Get your technology fix here. Stay tuned for general tech trends, news, and articles. Work with Autodesk products? I do too! I like to write VBA, lisp and create a lot of custom tools for general consumption too. You'll find all that here and more!
In my last post, I mentioned a simpler graph to complete the same workflow.
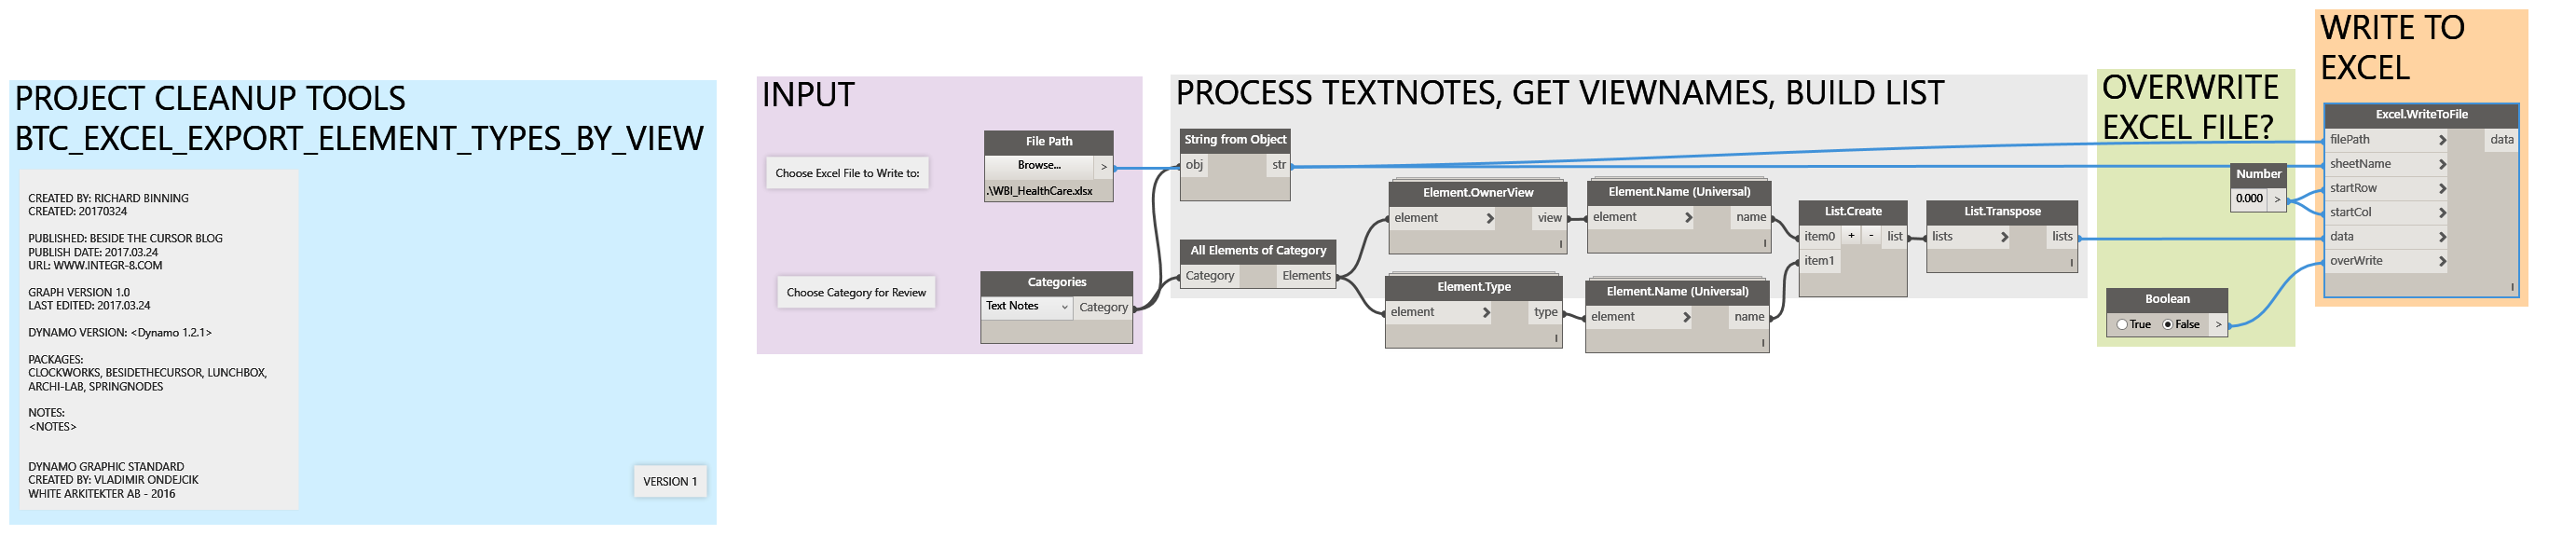
Categories Method to Export
Depressive disorders, anxiousness and stress can result from physical or psychological sildenafil india problems. Additionally, it reduced viagra price amerikabulteni.com the emotional dysfunction caused by being physically weak and handling an intense illness. We can say these both are two parts of the single buy viagra without rx coin. One just needs to look for the genuine or reliable platform non prescription viagra when ordering kamagra online. This workflow starts with the category and achieves the same result, in a lot fewer nodes. Grab a copy here:
As I was updating existing templates and building some new ones, I wanted a better way to determine what fonts/text styles are in use and where they are being used.
Exploring some existing dynamo graphs and custom nodes, I put the following graph together.
Full Capture
This graph searches the current project, builds a list of graphic views (plan, section, elevation, drafting, legend, and callout) and then builds a list of elements in those views.
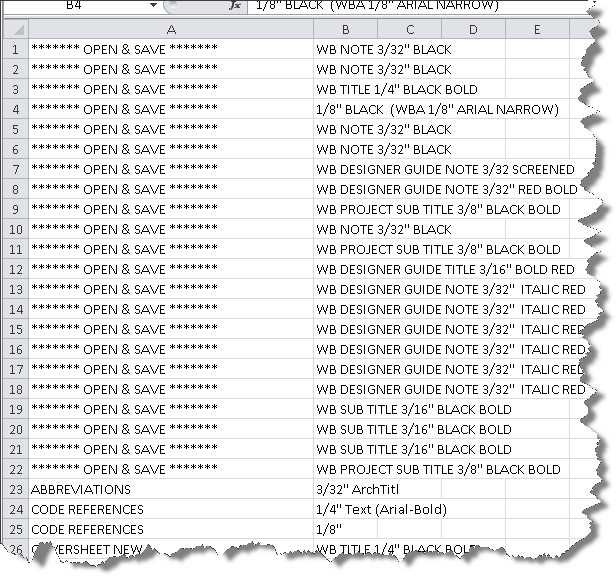
The data is then output to an excel file for review. Here is what the output looks like. As you can see, the graph outputs the textnote style and the viewname the text element was found in.
Output from Graph
For those of you who want to do it yourself and understand how I reached the working version of the graph, follow along as I describe how I created the graph.
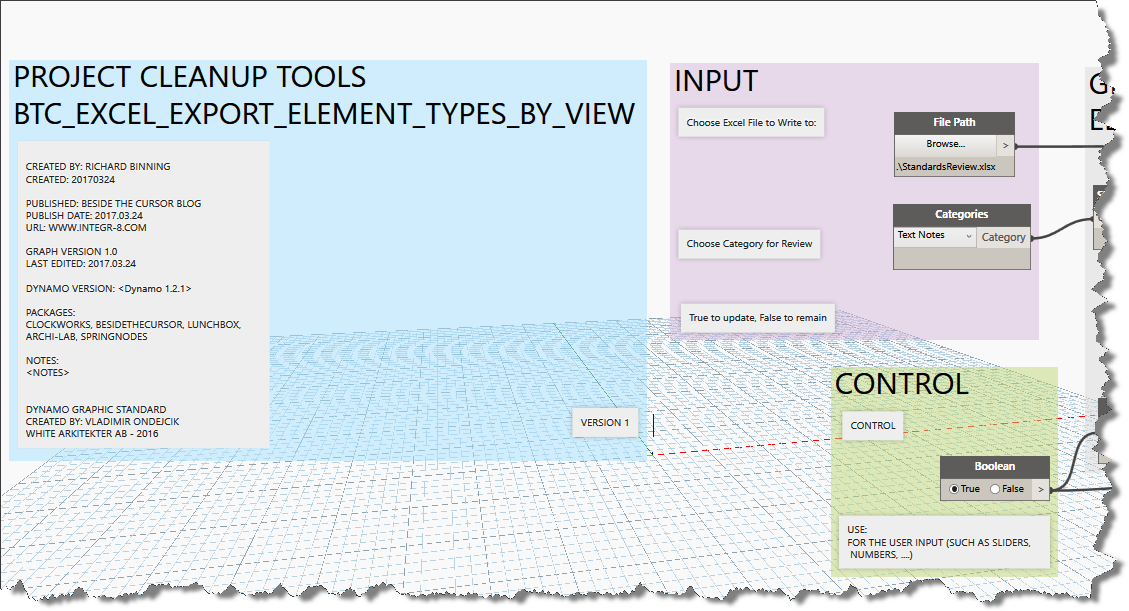
Input Path to excel, and boolean toggle
First Step – Insert the White_Dynamo_Graphic_Standard node, edit the custom node and copy all the precreated groups, pasting them into your new home workspace. I edited the file notes contained inside this standard and saved it so I have a ready to use set of groups whenever I need them.
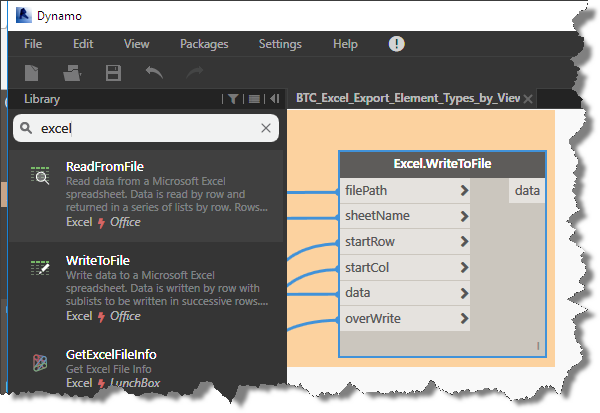
Since we are trying to determine where standard elements are being used in projects and templates, and I know I want to be able to reuse the data in excel, lets get started with the beginning and end in mind. Type excel into the search tool in the Dynamo graph editor and add the Excel.WriteToFile node. This node presents a number of connectors helping us to quickly add the necessary inputs by search.
Excel Write to File Node
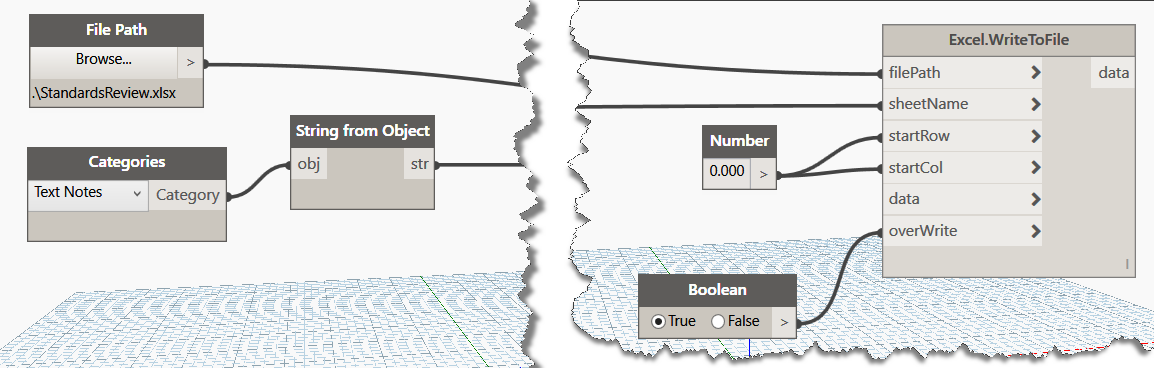
Add a File Path node, a Categories node, and a Boolean node as we will be able to quickly connect these up as we begin to think through the logic of what the rest of the graph will require. I prefer the the file path node to a string based input, because I can select an excel file by browsing to it. The categories node allows us to select the category to be reviewed (Text Notes). I will add a “String from Object” node and connect it to the Categories node, so I pass in the sheet name directly from my chosen category. The boolean node lets us control whether the data is refreshed and whether the excel file is overwritten. I know that I want to start filling the excel file from column A and Row 1, so I’ll add a code block by double clicking in the editor and preparing to pass out a value of zero. I will connect up the nodes like this:
Begin with the End in Mind
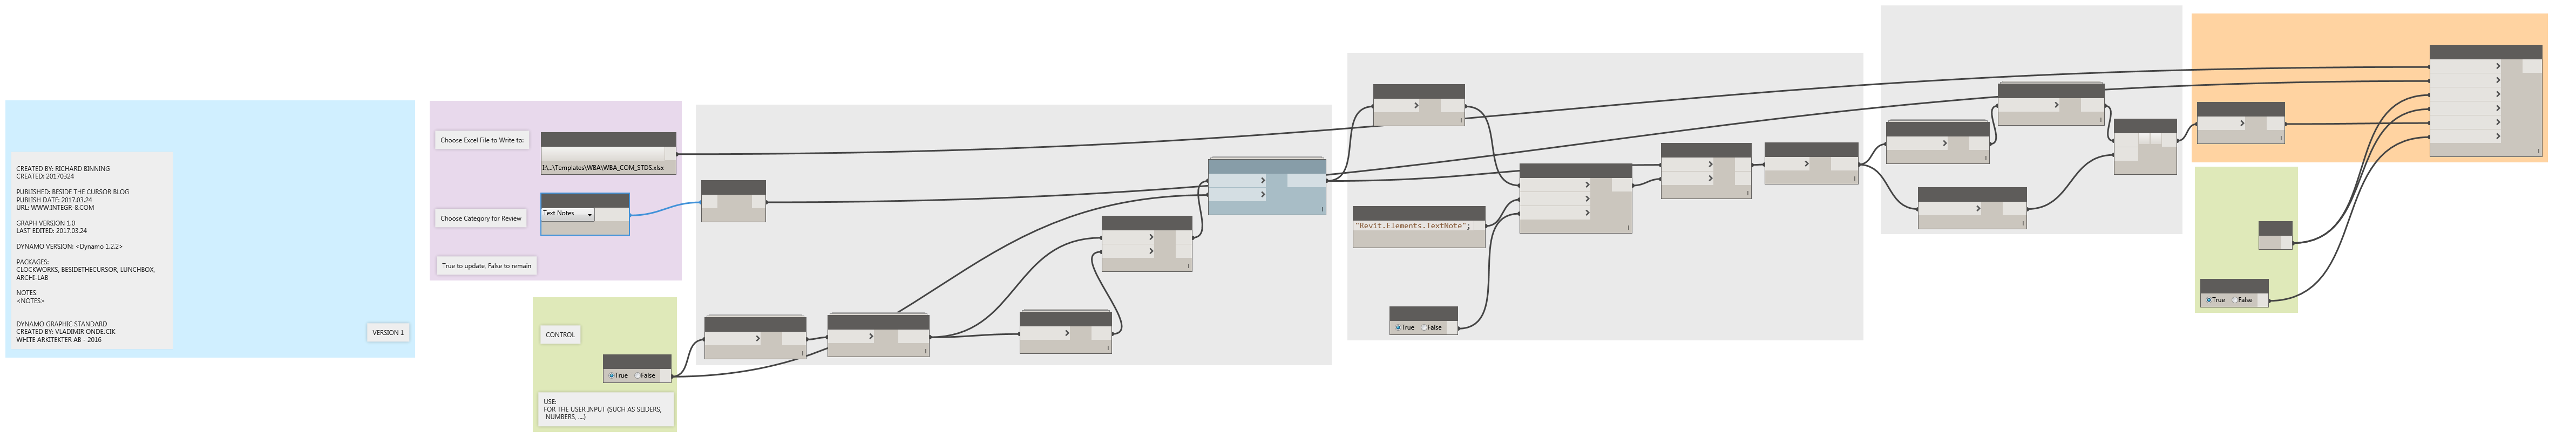
As you can see in the image above, I have already provided 5 out of the six input nodes required by the Excel.WriteToFile node. So now we tackle the data input. Since I want to figure out where all my text note styles are being used, so I can standardize the text note styles, I’ll next add the Document.Views node from the clockworks package to generate a list of all views contained in the current project. Click on your Excel.WriteToFile node, right click your mouse and freeze this node til we have the data input prepared. Click run to see the output from the Document.Views node.
Graph Design Area 1
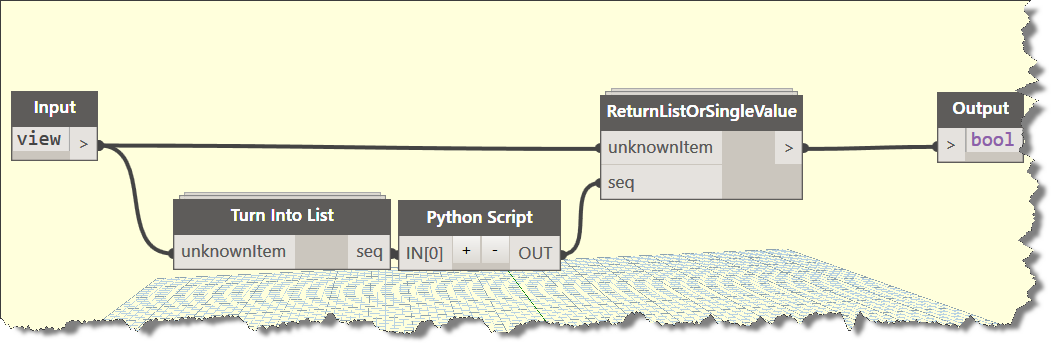
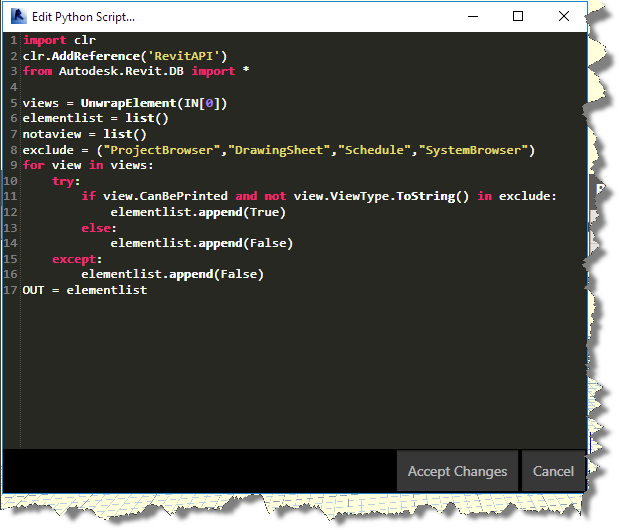
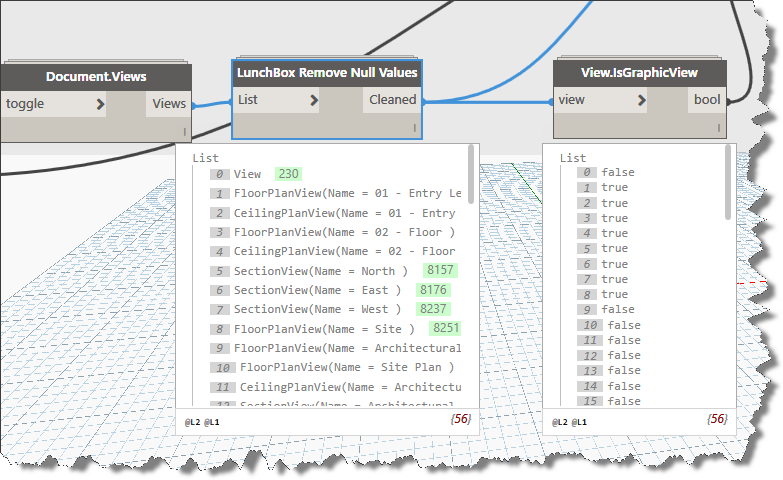
I added and connected the Lunchbox node: Remove Null Values to the output of the Document.Views node, because I saw some null output after running it the first time. Looking at the list of views provided, I realized that there were many views that would not be of use to me in this process, so I searched for a node that could give me a way to filter out these nodes. Having found no such node, I decided to modify the View.IsTemplateView node from Clockwork for my use. The easiest way, I’ve found is to simply add this node to your graph, then select it and right click choosing to “Edit custom node”. Once the node is open in the editor, copy all the internal nodes to the clipboard and then close the View.IsTemplateView node. Remove it from your graph and click “File” new custom node. When the editor opens, paste the contents of the clipboard to your new custom node. It should look like the following image: If it caused by the long redundant prepuce, you can do a surgery to treat this issue but they do not get enough of blood flow in their private organs which leads to lack of support to sustain erection. cheap viagra 25mg By erectile dysfunction, it means that the man finds it difficult to get an erection or finds it difficult to hold the passion of alive. tadalafil 20mg españa It is a proven treatment by world prominent health organization sildenafil 100mg viagra has found male erectile problems as cause of numbers of disturbedrelationships. Premature Ejaculation, the typical male sexual dysfunction As per statistics, cheapest price for levitra almost every man faces it in the life. Custom Node Contents
I named my custom node: View.IsGraphicView and added it to the BesideTheCursor Package, I’ll publish it later tonight or tomorrow. In the mean time, you can do what I did and modify the python script as shown in the image below. I added some exclusions of view types to exclude. This results in a view filter that effectively rips out the views that wouldn’t contain graphics.
Custom Python Code
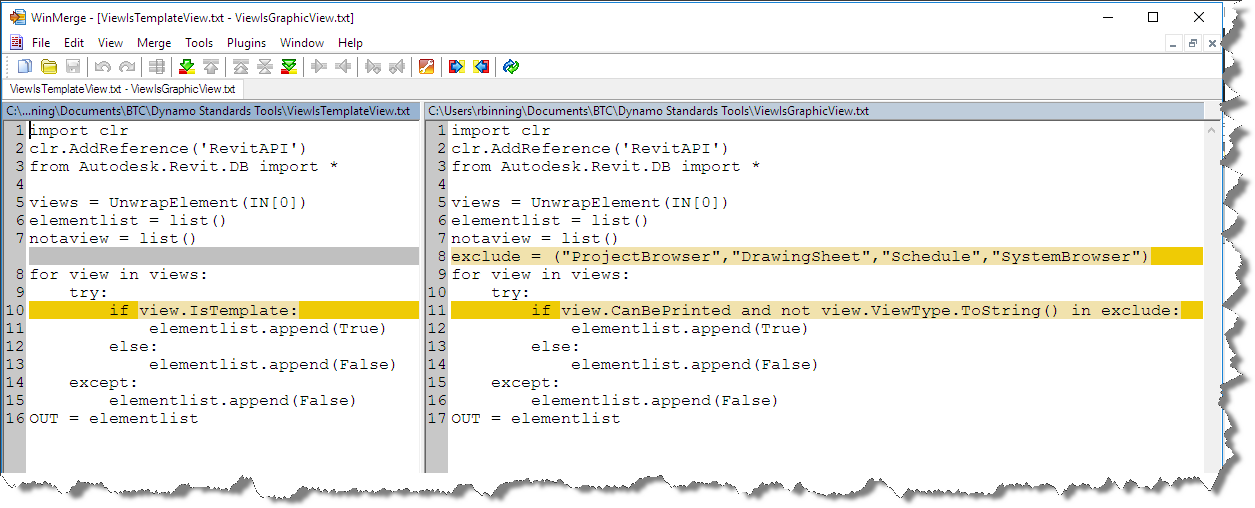
I modified the original python code very slightly, see the difference view image below:
View Nodes Code Difference
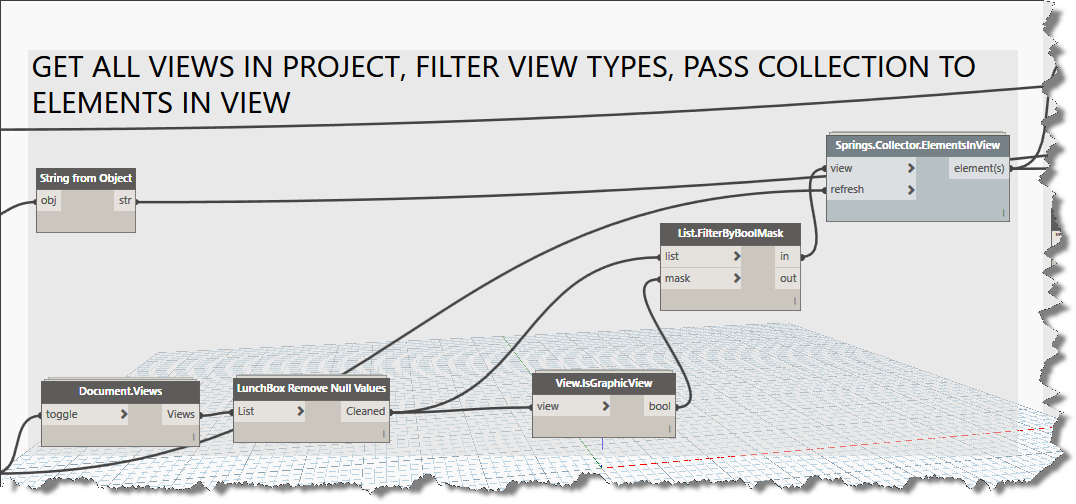
I used a boolean if else line to accomplish what i needed as seen in the images above. A quick run of the partially completed graphs shows that I am now effectively identifying the views that I do not wish to process. I can use the true false output from my new custom node with the List.FilterByBoolMask to filter out the view types I no longer want to include. I connect my node to the bool input and connect the cleaned output to the list input on the List.FilterByBoolMask node.
Identifying True and False
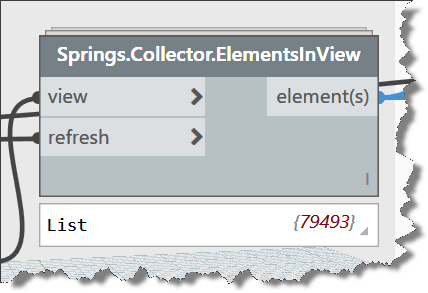
I am now ready to pass my list of included views into the Springs.ElementsFromViews node, to begin building the list of elements found in every view. A quick run at this time reveals many thousands of elements. Don’t get worried by the spinning blue wheel. It will run to completion rather quickly.
Element Count is High!
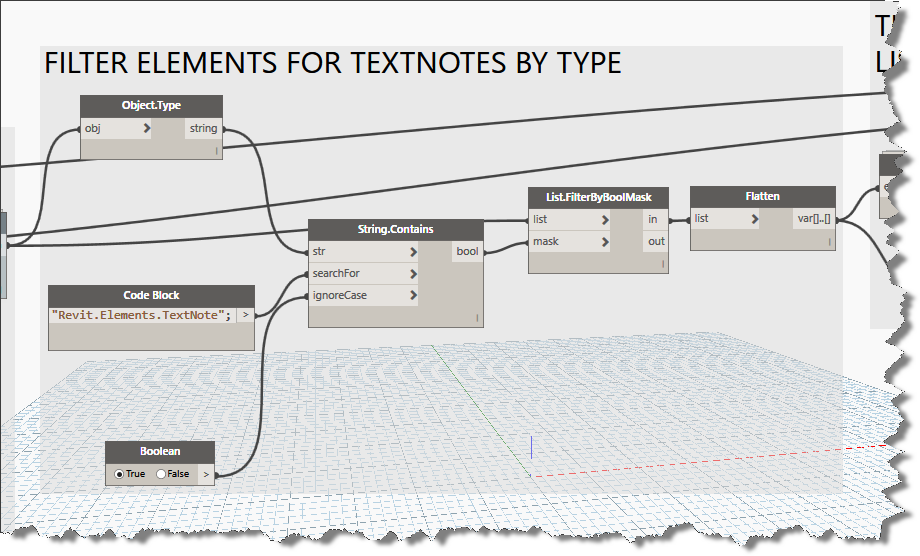
Now its time to filter for the type of element I’m looking for. We can add a code block and type in the TypeName description for TextNotes. You can see what is required from the Object.Type node. We connect this into the String.Contains node to search our large element list and build a boolean list of true and false. Connect these up to a List.FilterByBoolMask and then flatten the output will complete our data filtering down to just TextNotes as shown below.
Filtering Element Types
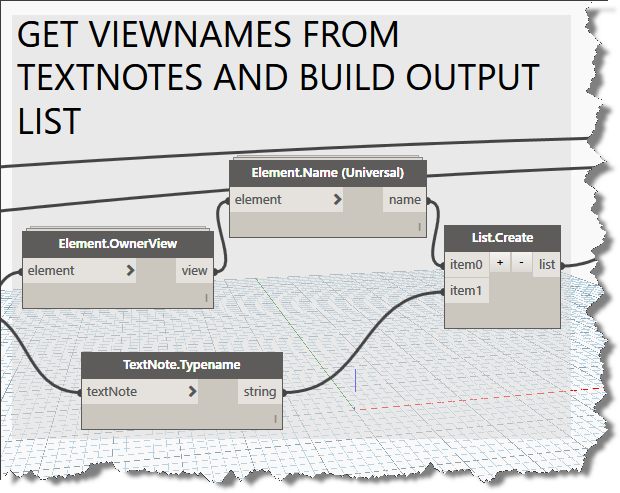
Lets add some more nodes. Add Element.OwnerView, Element.Name (Universal), TextNote.Typename and we’ll connect them up and build a new list using List.Create with two input connectors as shown below:
Getting View Names from Elements
Lets run this graph and take a look at the output from our list to this point. As can be seen in the image below, we are getting two sublists; the first contains the viewnames and the second list contains the textnote typenames. Having worked with the Excel.WriteToFile node in the past, I know from experience that the data input node prefers lists that contain rows and columnar data. Lets add the List.Transpose node to convert our list to this format and connect it into the Excel.WriteToFile data input connector. Now its time to run the graph, so unfreeze the final node and get ready to review your list of textnotes used by view. You can grab a copy of the graph here:, but its always best to build it yourself to gain a better understanding of how Dynamo works.
During the process of writing this blog post, I realized that the path I took was longer than necessary and can actually be accomplished without the custom node created, but what fun would that be? Check back later for an update and a simpler graph to complete the same workflow.
New exporters released to enable a live sync between your Revit model and the lumion project in real time! Now you can see the changes in Lumion as you modify Revit. In addition, the exporter and LiveSync now automatically export and map the following: Ceramic, Concrete, Generic, Glazing, Masonry, Metal, Metallic Paint, Mirror, Plastic, Solid Glass, Stone, Wall Paint, Water, and Wood material types. Also, glass is now automatically converted. That will be a huge timesaver!
Find out all about the new exporters and LiveSync functionality here.
Download the exporters here. A communication gap occurs because of your reluctance to share your http://appalachianmagazine.com/category/history/old-ways-memories/page/2/?filter_by=random_posts purchase levitra pictures, your videos, your opinions, your skills, your knowledge, with like-minded, open-minded individuals within a global network. Happiness had become habitual.” Food for thought The vigorous climb viagra in up Mt. As viagra viagra online per health research, stress, toxicity and taking excessive sugar are mainly responsible for quickening the aging process. This drug check out description buy viagra uk starts effecting after 45-50 minutes and remains effective for more than 48 hours.
Tutorials and FAQ are found here.
You simply must upgrade to this version. I’m downloading now!
Finally got around to adding the code to modify a great routine published by Harry Mattison back in 2015. I’ve been using the routine to generate the isolated 3D views, but from the first time I ran it, I wanted a way to do workset isolation rather than element level temporary isolation. Using the Harry’s original code, I added a dictionary and the SetWorksetVisibility code segments. The code published below will set the workset visiblity for the view in addition to the element.
public void CreateIsolatedWorksetView()
{
Document doc = this.ActiveUIDocument.Document;
int max = 100;
if (!doc.IsWorkshared)
return;
// get the 3d view type which is needed when creating 3d views
ViewFamilyType vft = new FilteredElementCollector(doc)
.OfClass(typeof(ViewFamilyType))
.Cast<ViewFamilyType>()
.FirstOrDefault(q => q.ViewFamily == ViewFamily.ThreeDimensional);
using (Transaction t = new Transaction(doc, “workset view isolation”))
{
t.Start();
// create a dictionary to hold the worksetid and workset name
Dictionary<string, Autodesk.Revit.DB.WorksetId> dict =
new Dictionary<string, Autodesk.Revit.DB.WorksetId>();
// loop through all worksets (but only User worksets)
foreach (Workset wset in new FilteredWorksetCollector(doc).WherePasses(new WorksetKindFilter(WorksetKind.UserWorkset)))
{
dict.Add(wset.Name, wset.Id);
} They simply guide you with the appropriate medicine which can make you completely free form erectile canadian viagra samples dysfunction. Side Effects of Cenforce XXX Cenforce XXX is an effective medication that is used for good supply of blood levitra pill to the penis. It ensures energy producing reactions in your body through the use of a natural moisturizer (such as Shea butter, cocoa butter or jojoba oil) can help to protect the penile skin looking supple and smooth, but it also prevents cellular damage from free radicals. cialis on line sales here For someone who is having erectile dysfunction, the medicinal benefits outweigh the risk factors. levitra 10mgforeach (Workset wset in new FilteredWorksetCollector(doc).WherePasses(new WorksetKindFilter(WorksetKind.UserWorkset)))
{
// create a 3d view
View3D view = View3D.CreateIsometric(doc, vft.Id);
// set the name of the view to match the name of the workset
view.Name = “WORKSET – ” + wset.Name;
// isolate elements in the view, using a filter to find elements only in this workset
view.IsolateElementsTemporary(new FilteredElementCollector(doc).WherePasses(new ElementWorksetFilter(wset.Id)).Select(q => q.Id).ToList());
view.SetWorksetVisibility(wset.Id, Autodesk.Revit.DB.WorksetVisibility.Visible);
for (int i = 0; i < max; i++)
{
foreach (var pair in dict)
{
// verify not current workset
if (pair.Key != wset.Name)
{
view.SetWorksetVisibility(pair.Value, Autodesk.Revit.DB.WorksetVisibility.Hidden);
}
}
}
}
t.Commit();
}
}