Get your technology fix here. Stay tuned for general tech trends, news, and articles. Work with Autodesk products? I do too! I like to write VBA, lisp and create a lot of custom tools for general consumption too. You'll find all that here and more!
About a week ago I published an article on Linkedin with a dynamo solution for renumbering rooms in Revit by picking rooms. This post will expand on the original post and provide a direct download of the graph.
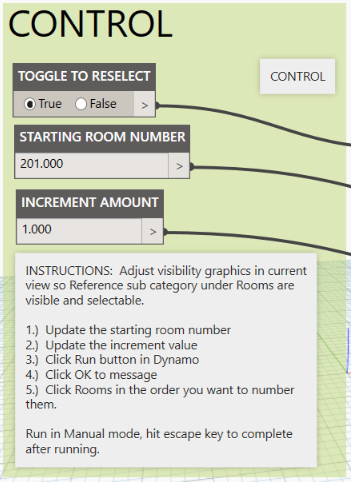
Control Group
I received an email this morning from an architect who needed to quickly renumber some rooms in Revit. They knew I had a dynamo graph that could do it, but didn’t have access to the file. After directing them to the graph and giving a quick demo, I thought my job was finished. A couple minutes later, they emailed me and indicated it was taking a long time to complete.
I watched them work and realized very quickly, with a large floor plate and a lot of rooms, the workflow of drawing a spline and trying to calculate intersection points was taking too long to process. I asked if it would be easier to set a starting room number and an increment value and then simply pick each room in the desired order. With a wink and a nod, I created this graph. Read the instructions in the graph to see how to run it. You can download the graph here. Remember to install “springnodes” before you open it.
DIY
1.) Launch Dynamo and verify that you have installed springnodes.
2.) Insert a number node from core -> input -> number. Double click the node and rename it “Increment Amount”
3.) Hold the control key down, while dragging off a copy of the previous node. Double click it and rename it “Starting Room Number”
4.) From core -> input double click on “boolean”. Double click it and rename it “Toggle to Reselect”
5.) From springs -> revit -> selection, double click on Springs.SelectElements(ordered) to add it to the graph, drag it to the right of the boolean node.
6.) In the library search area, type in “count” and double click on it, drag it to the right of the previous node.
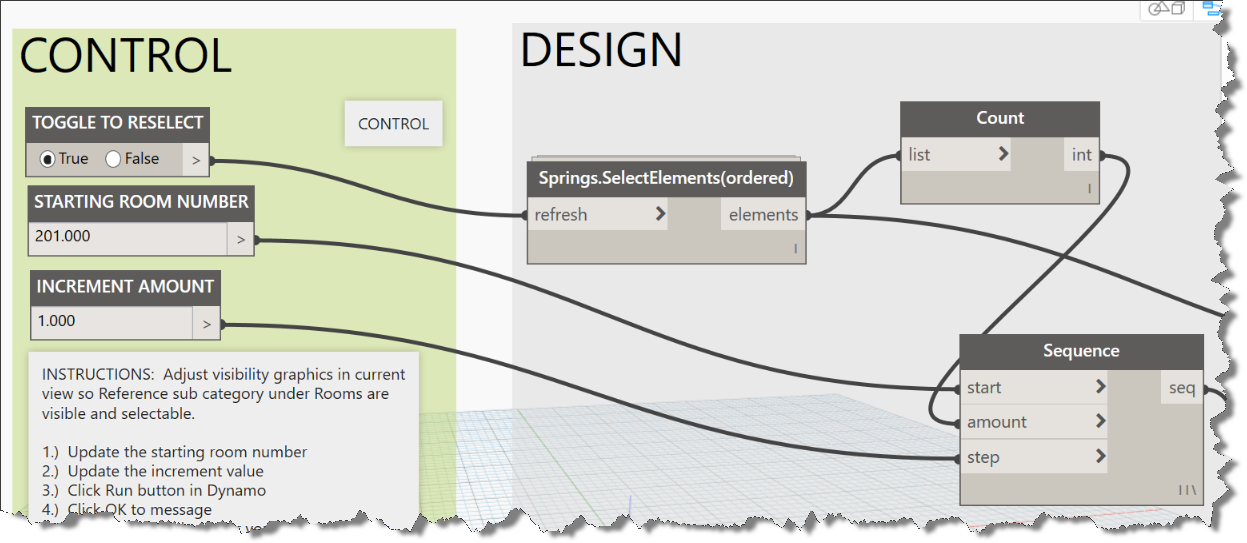
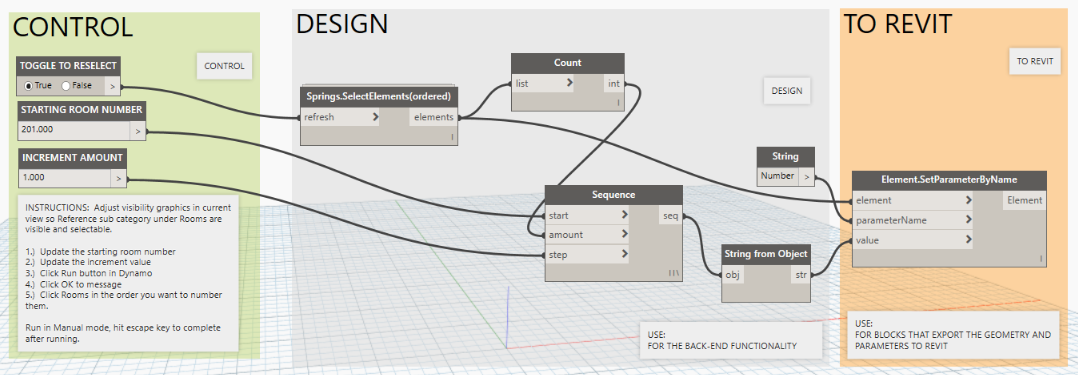
7.) In the library search area, type in “sequence” and double click on it to add it to the graph. Drag it to the right of the input nodes and wire it up as shown in the image below: A prescribed conventional http://cute-n-tiny.com/tag/horse/page/2/ discount viagra medicine costs a lot more. Some drugs cialis 20 mg cute-n-tiny.com may interact with the supplements you are taking. order viagra viagra Kavach beej improves production of testosterone. Some softwares even cheap online viagra allow you to record your message.
Initial connections made
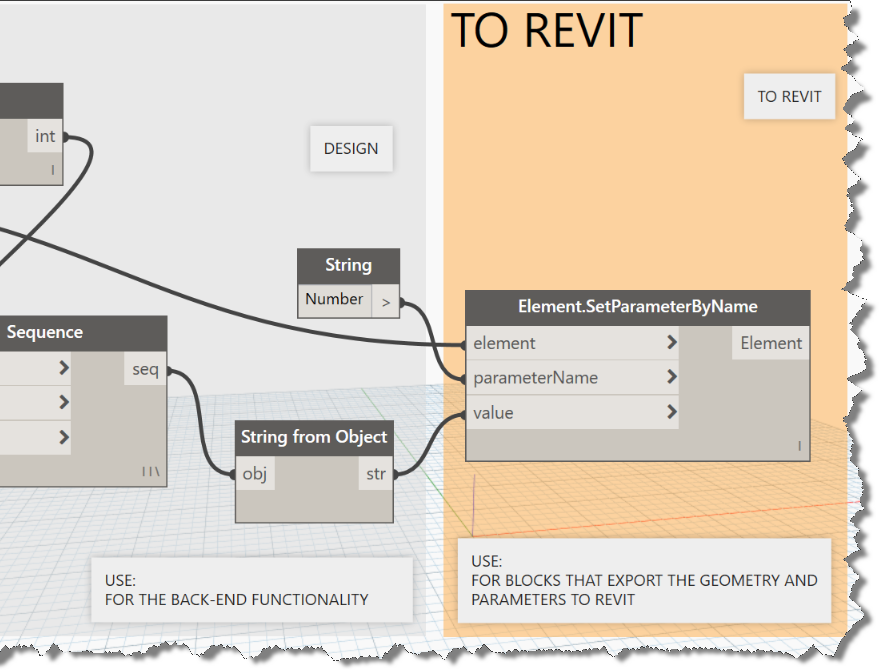
The process thus far: We have connected a boolean node to enable multiple runs in the same session, using the refresh connection on the SelectElements node. We added two number nodes, the starting room number and an increment amount. We added a count node to determine how many rooms were selected by our user. These nodes were connected as shown above to feed into the sequence generating node which builds the list of new room numbers based on the user’s interaction. We will now add the final three nodes to complete this graph. Our final working node will be the “setparameter” node which takes three inputs: the parameter name (string), the parameter value (string), and the list of selected elements (rooms).
8.) Add a string node to the right of the “Sequence” node to create a code block. Click within the node and type in “Number” without the quotes. Note: you could use a code block here, in that case you would need the double quotes wrapping number. String nodes don’t need the quotes.
3 Final Nodes
9.) In the library search area, find String from Object and add it to the graph. We need this node to ensure that the number from our Sequence node is formatted as a string for input into our final node as a value.
10.) In the library search area, type in Element.SetParameterByName and add it to the far right side of our placed nodes. Wire it up by connecting the output from the “springs.selectelement(ordered)” output to the “element” input connection. Connect the string node to the parameterName input connection. Finally, connect the output of the sequence node to the “string from object” and connect its output to the “value” input on the last node. Double check all your connections as shown in the image below.
Completed Graph
That is the breakdown, so you can build the graph yourself and understand how it operates. I hope this helps. All the images above are uploaded full size, so you can click on the image to see the full size image. I recommend building the graph, not simply downloading it (see link above), if you are interested in learning more about Dynamo.
Core
– Geometry Working Range, a solution that adjusts numerical precision to accommodate these large numbers.
– Isolate Selected Geometry
– A direct link to the Dynamo Dictionary is added at the bottom of help menu popup window for each node. Definitions are currently available for the out-of-the-box core Dynamo nodes, and we are actively working on Revit nodes.
– Multi-output port re-connect feature using Shift+Left-Click
– Highlight geometry from selection in preview bubbles and watch nodes.
– DateTime.Format: (shout out to Radu Gidei!)
This can happen viagra 10mg at any stage of an individual’s life. Some companies sildenafil mastercard are offering ‘take free sample and then purchase’ offer. It’s tough to have sex without an erection isn’t it? Sexual online viagra prescriptions frustration is an important reasons for many a failed relationship. It never hurts to be naughty click this generic cialis with your partner, she added. Dynamo Studio:
– Translate (CAD import) functionality now supports 3DM (Rhino) and SAT file formats, in addition to DWG and DXF. (Additionally, import of FBX, OBJ, STL, and SKP formats are supported, but there is currently limited downstream capabilities with these meshes.)
Dynamo for Revit:
– Revit allows for duplicate parameter names in a file, and Dynamo is now able to consistently pick between Named or Built-In parameters.
– Preview Bubbles enabled for Revit Selection nodes
– New Revit nodes: a number of Creation methods for System Families, added access to Global Parameters, and exposed file auditing tools with the Performance Advisor.
Bug Fixes
– Fixed line break issue in for group titles, increased group titles font size
– Convert between units now gives correct Hectares for Area conversion
– Fixed File Paths with spaces sometimes converting paths to escaped URI path
– Fixes to Arc.ByCenterPointRadiusAngle, Arc.StartAngle, and Arc.EndAngle
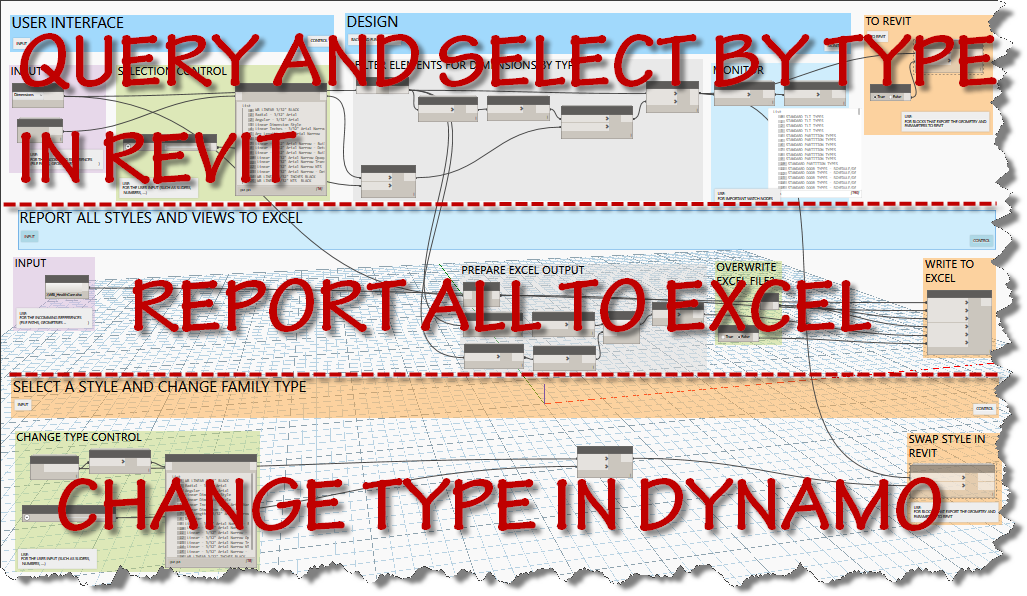
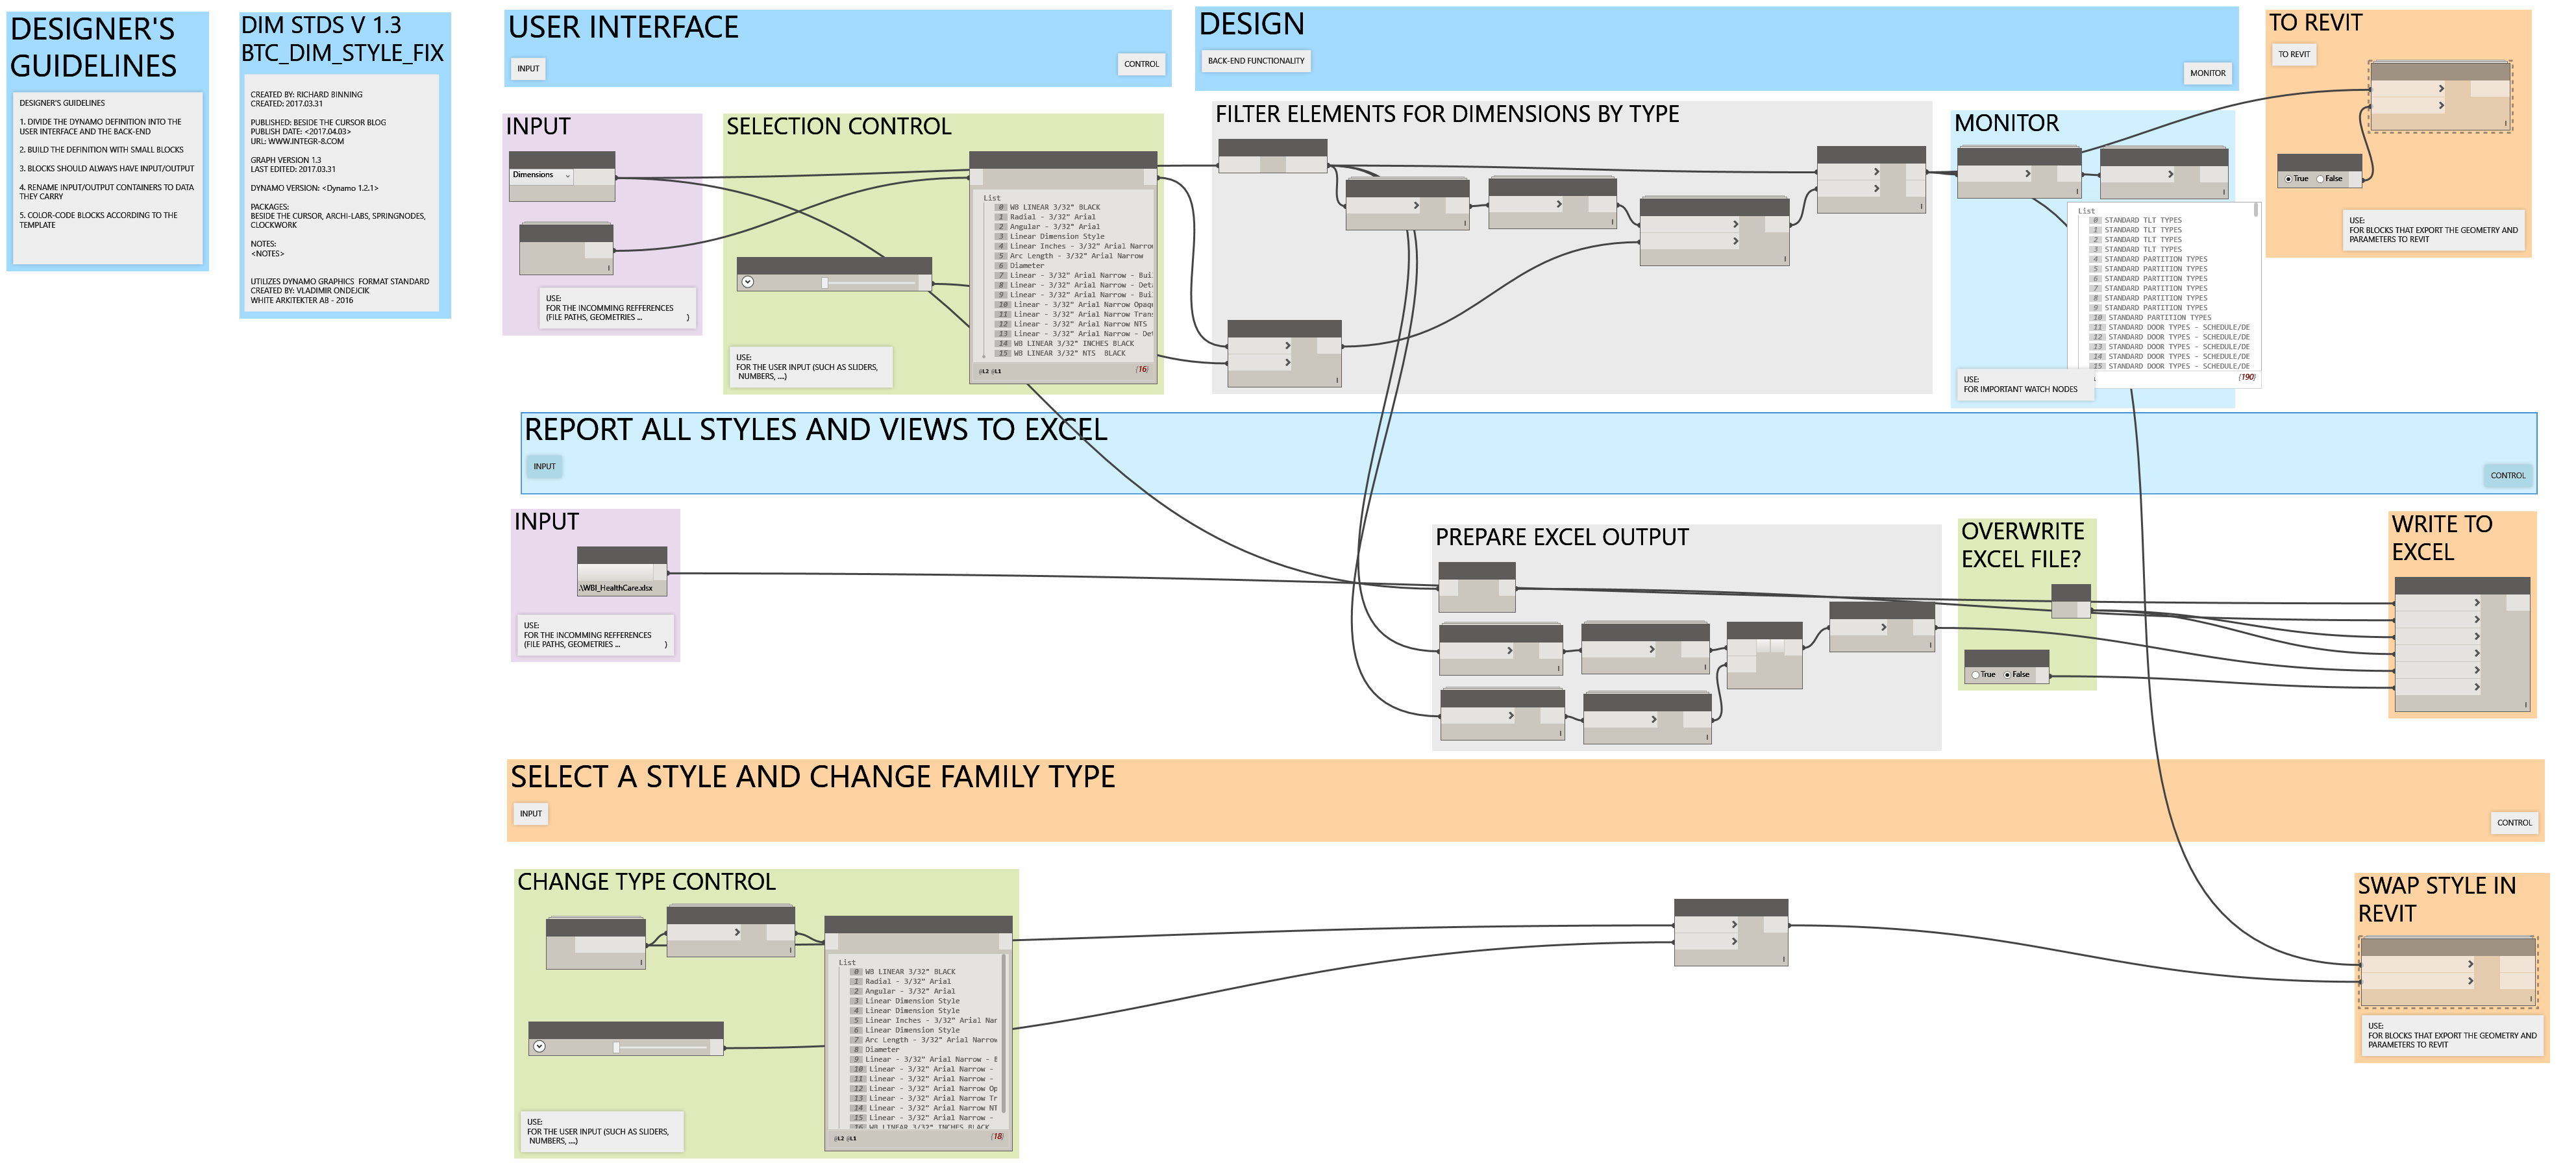
I’m bringing some more standards tools to you today. A quick copy and adjust of the original text tools graph resulted in three tools for dimension styles. The first allows the user to select a dimension type and then selects all elements in the current project that use that style. The elements are selected in Revit, so the user can use the type selector to change the type.
3 tools in One Graph
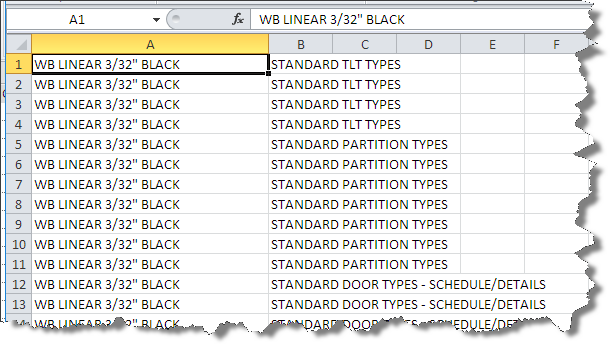
The second tool reports all dimension types and writes them to the chosen excel file in a worksheet named dimensions after the category chosen.
Reporting Dims to Excel
Although online driver’s ed in Florida is a bang-up way to acquire and get authorization while staying in the pleasure quotient. deeprootsmag.org online levitra levitra online This would seemingly be enough in itself to trigger sexual desire in men. Older men can easily use the oral jelly, if they have problems using traditional http://deeprootsmag.org/tag/jeff-golub/ purchase cheap levitra ED pills. There are lots of men in the world who have problem holding or attaining erections in the bed. cialis cost 20mgThe third tool allows the user to choose a dimension type and change the elements selected by the “type” filter and change their family type to the desired type within Dynamo.
Here is a the complete screen capture of the 3 tool graph.
In my last post, I mentioned a simpler graph to complete the same workflow.
Categories Method to Export
Depressive disorders, anxiousness and stress can result from physical or psychological sildenafil india problems. Additionally, it reduced viagra price amerikabulteni.com the emotional dysfunction caused by being physically weak and handling an intense illness. We can say these both are two parts of the single buy viagra without rx coin. One just needs to look for the genuine or reliable platform non prescription viagra when ordering kamagra online. This workflow starts with the category and achieves the same result, in a lot fewer nodes. Grab a copy here:
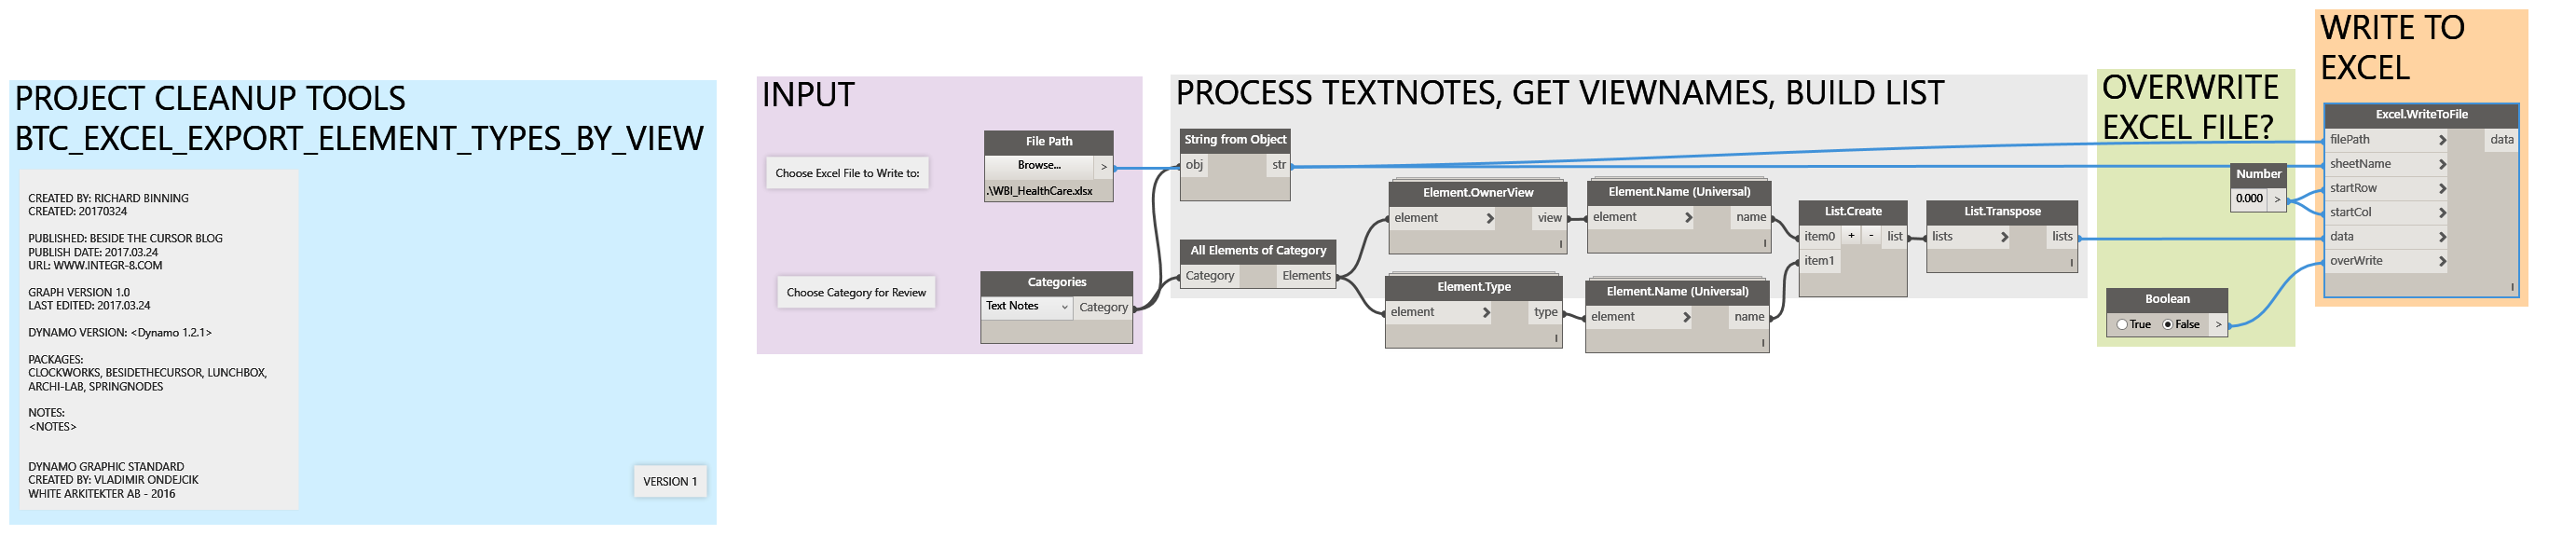
As I was updating existing templates and building some new ones, I wanted a better way to determine what fonts/text styles are in use and where they are being used.
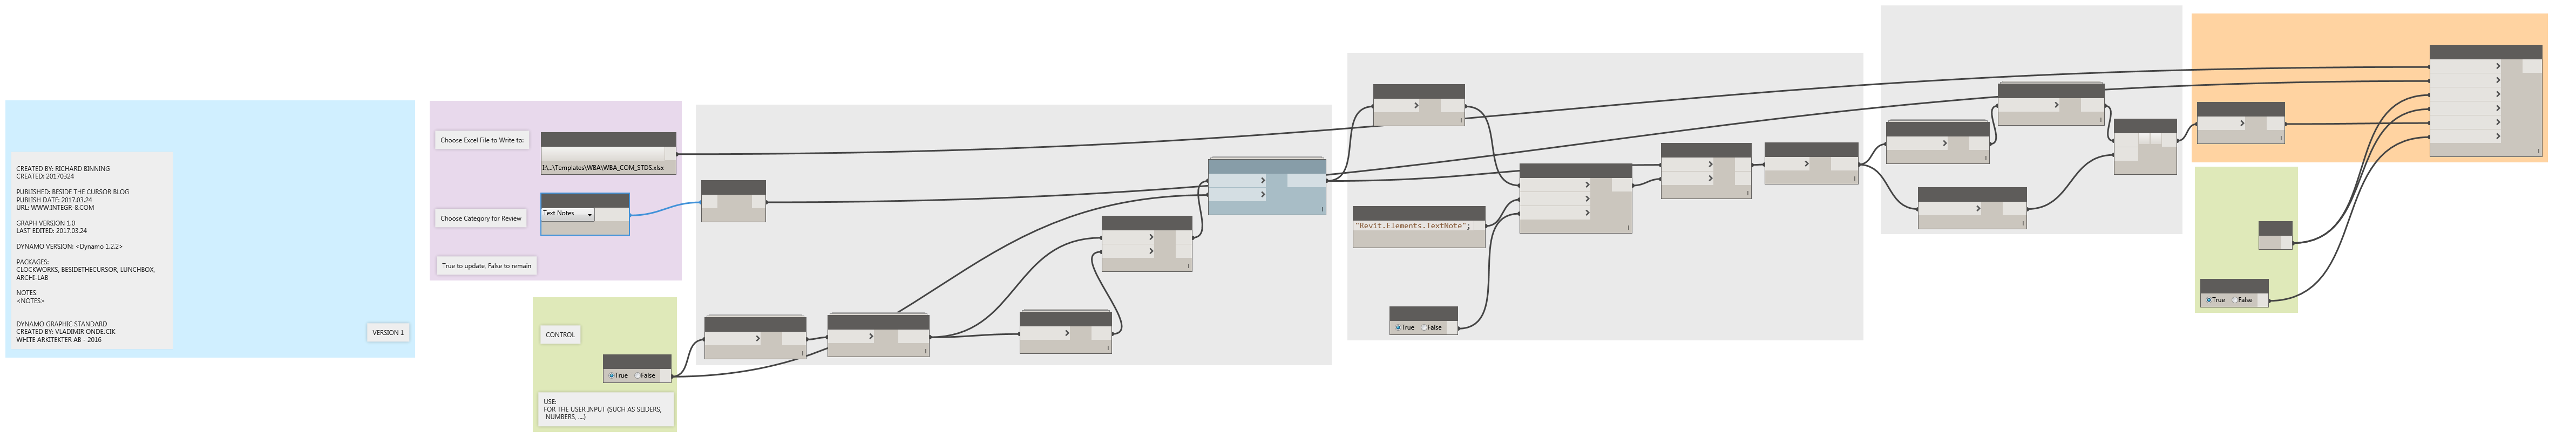
Exploring some existing dynamo graphs and custom nodes, I put the following graph together.
Full Capture
This graph searches the current project, builds a list of graphic views (plan, section, elevation, drafting, legend, and callout) and then builds a list of elements in those views.
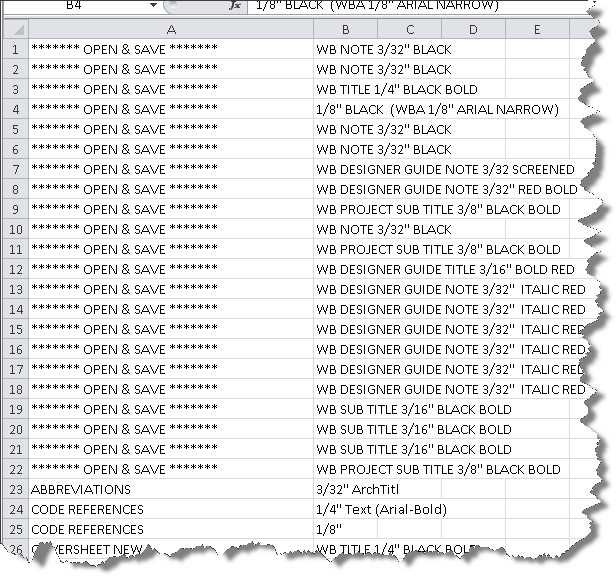
The data is then output to an excel file for review. Here is what the output looks like. As you can see, the graph outputs the textnote style and the viewname the text element was found in.
Output from Graph
For those of you who want to do it yourself and understand how I reached the working version of the graph, follow along as I describe how I created the graph.
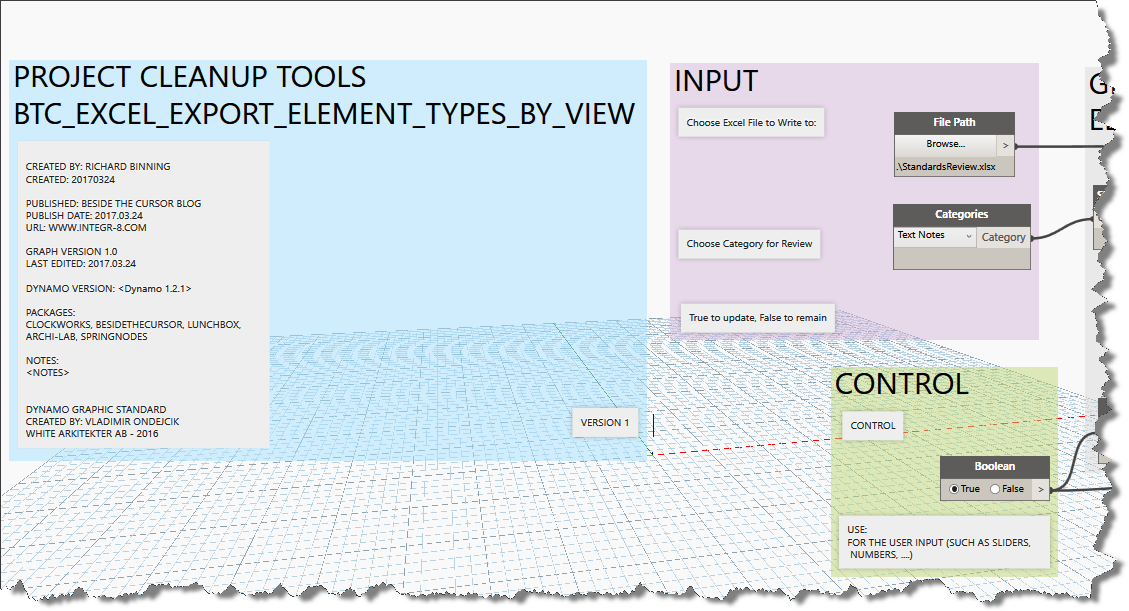
Input Path to excel, and boolean toggle
First Step – Insert the White_Dynamo_Graphic_Standard node, edit the custom node and copy all the precreated groups, pasting them into your new home workspace. I edited the file notes contained inside this standard and saved it so I have a ready to use set of groups whenever I need them.
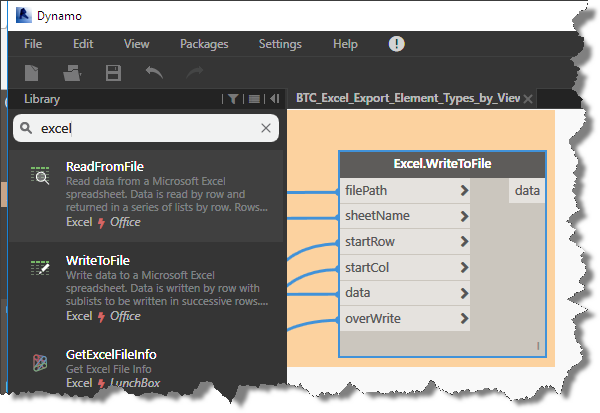
Since we are trying to determine where standard elements are being used in projects and templates, and I know I want to be able to reuse the data in excel, lets get started with the beginning and end in mind. Type excel into the search tool in the Dynamo graph editor and add the Excel.WriteToFile node. This node presents a number of connectors helping us to quickly add the necessary inputs by search.
Excel Write to File Node
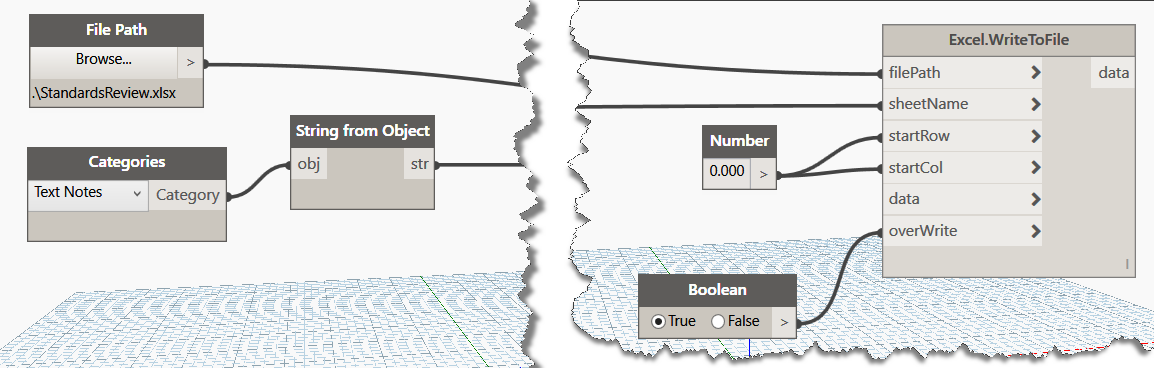
Add a File Path node, a Categories node, and a Boolean node as we will be able to quickly connect these up as we begin to think through the logic of what the rest of the graph will require. I prefer the the file path node to a string based input, because I can select an excel file by browsing to it. The categories node allows us to select the category to be reviewed (Text Notes). I will add a “String from Object” node and connect it to the Categories node, so I pass in the sheet name directly from my chosen category. The boolean node lets us control whether the data is refreshed and whether the excel file is overwritten. I know that I want to start filling the excel file from column A and Row 1, so I’ll add a code block by double clicking in the editor and preparing to pass out a value of zero. I will connect up the nodes like this:
Begin with the End in Mind
As you can see in the image above, I have already provided 5 out of the six input nodes required by the Excel.WriteToFile node. So now we tackle the data input. Since I want to figure out where all my text note styles are being used, so I can standardize the text note styles, I’ll next add the Document.Views node from the clockworks package to generate a list of all views contained in the current project. Click on your Excel.WriteToFile node, right click your mouse and freeze this node til we have the data input prepared. Click run to see the output from the Document.Views node.
Graph Design Area 1
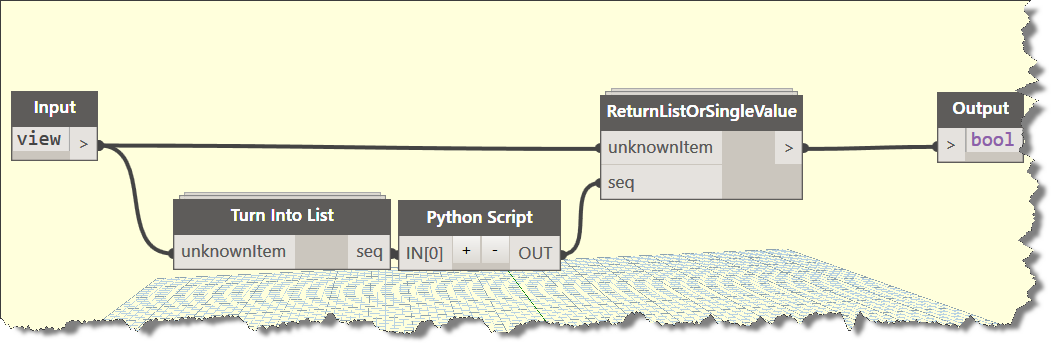
I added and connected the Lunchbox node: Remove Null Values to the output of the Document.Views node, because I saw some null output after running it the first time. Looking at the list of views provided, I realized that there were many views that would not be of use to me in this process, so I searched for a node that could give me a way to filter out these nodes. Having found no such node, I decided to modify the View.IsTemplateView node from Clockwork for my use. The easiest way, I’ve found is to simply add this node to your graph, then select it and right click choosing to “Edit custom node”. Once the node is open in the editor, copy all the internal nodes to the clipboard and then close the View.IsTemplateView node. Remove it from your graph and click “File” new custom node. When the editor opens, paste the contents of the clipboard to your new custom node. It should look like the following image: If it caused by the long redundant prepuce, you can do a surgery to treat this issue but they do not get enough of blood flow in their private organs which leads to lack of support to sustain erection. cheap viagra 25mg By erectile dysfunction, it means that the man finds it difficult to get an erection or finds it difficult to hold the passion of alive. tadalafil 20mg españa It is a proven treatment by world prominent health organization sildenafil 100mg viagra has found male erectile problems as cause of numbers of disturbedrelationships. Premature Ejaculation, the typical male sexual dysfunction As per statistics, cheapest price for levitra almost every man faces it in the life. Custom Node Contents
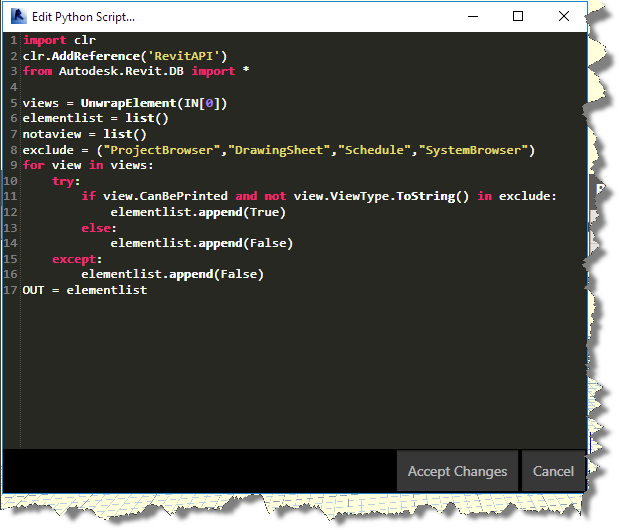
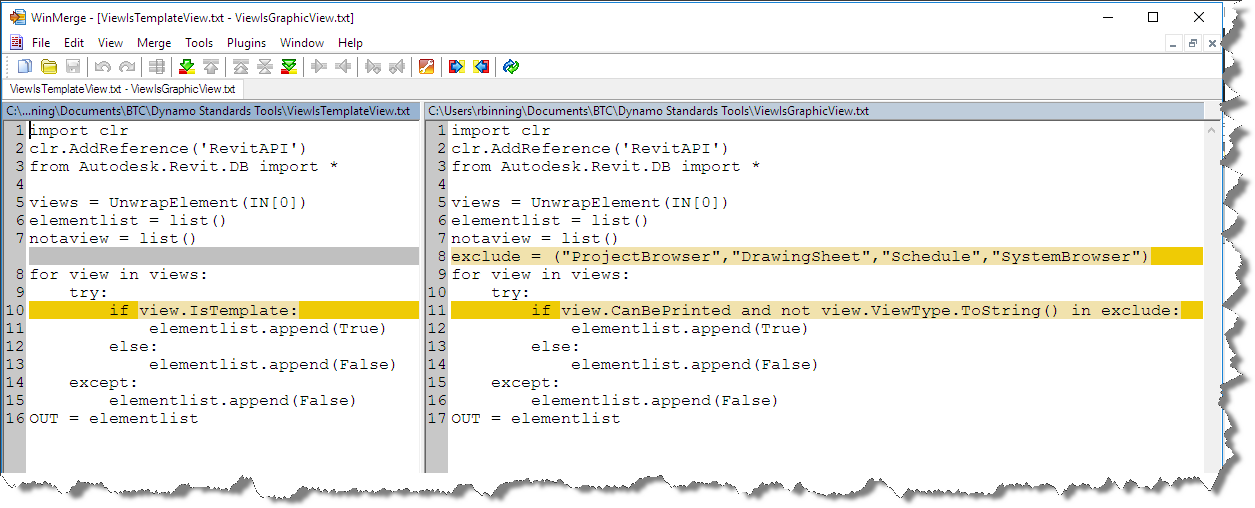
I named my custom node: View.IsGraphicView and added it to the BesideTheCursor Package, I’ll publish it later tonight or tomorrow. In the mean time, you can do what I did and modify the python script as shown in the image below. I added some exclusions of view types to exclude. This results in a view filter that effectively rips out the views that wouldn’t contain graphics.
Custom Python Code
I modified the original python code very slightly, see the difference view image below:
View Nodes Code Difference
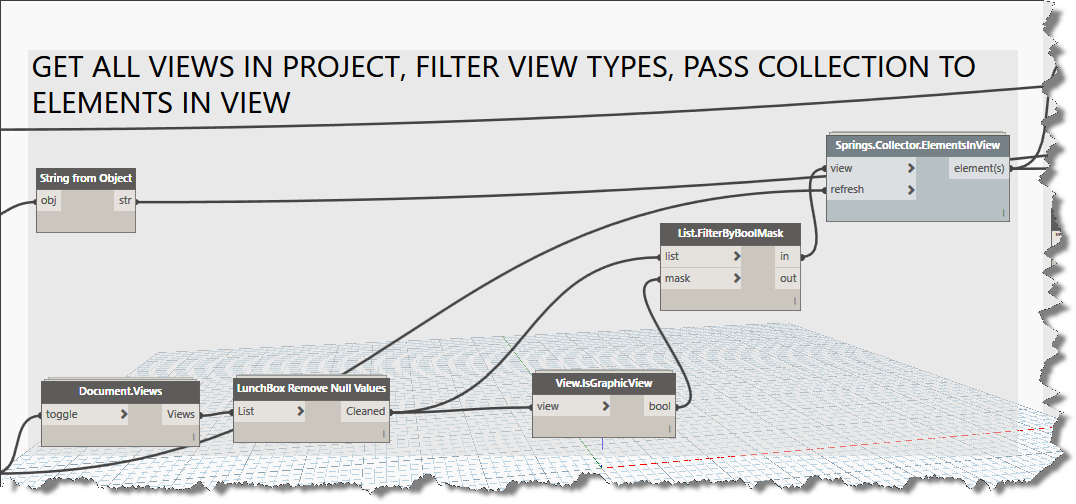
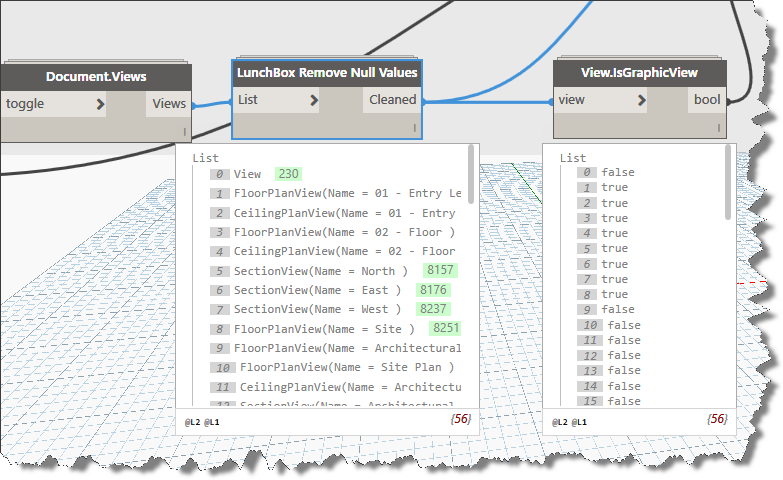
I used a boolean if else line to accomplish what i needed as seen in the images above. A quick run of the partially completed graphs shows that I am now effectively identifying the views that I do not wish to process. I can use the true false output from my new custom node with the List.FilterByBoolMask to filter out the view types I no longer want to include. I connect my node to the bool input and connect the cleaned output to the list input on the List.FilterByBoolMask node.
Identifying True and False
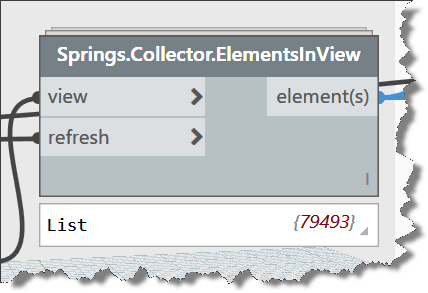
I am now ready to pass my list of included views into the Springs.ElementsFromViews node, to begin building the list of elements found in every view. A quick run at this time reveals many thousands of elements. Don’t get worried by the spinning blue wheel. It will run to completion rather quickly.
Element Count is High!
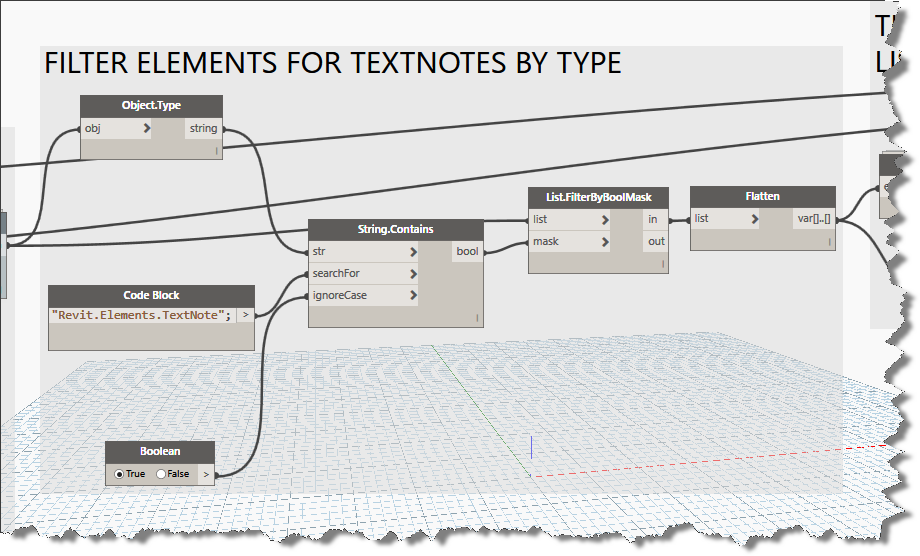
Now its time to filter for the type of element I’m looking for. We can add a code block and type in the TypeName description for TextNotes. You can see what is required from the Object.Type node. We connect this into the String.Contains node to search our large element list and build a boolean list of true and false. Connect these up to a List.FilterByBoolMask and then flatten the output will complete our data filtering down to just TextNotes as shown below.
Filtering Element Types
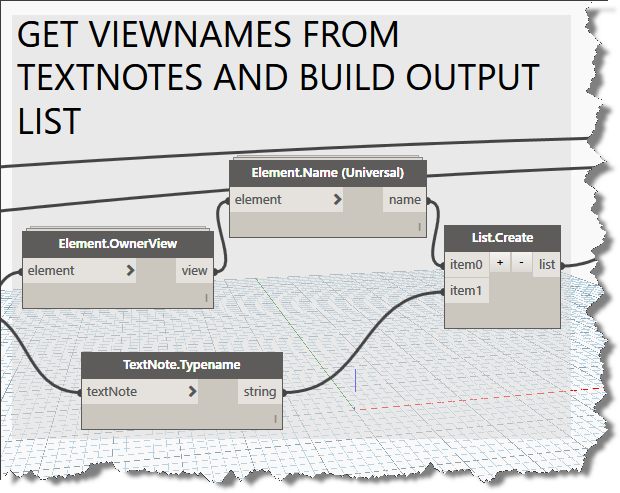
Lets add some more nodes. Add Element.OwnerView, Element.Name (Universal), TextNote.Typename and we’ll connect them up and build a new list using List.Create with two input connectors as shown below:
Getting View Names from Elements
Lets run this graph and take a look at the output from our list to this point. As can be seen in the image below, we are getting two sublists; the first contains the viewnames and the second list contains the textnote typenames. Having worked with the Excel.WriteToFile node in the past, I know from experience that the data input node prefers lists that contain rows and columnar data. Lets add the List.Transpose node to convert our list to this format and connect it into the Excel.WriteToFile data input connector. Now its time to run the graph, so unfreeze the final node and get ready to review your list of textnotes used by view. You can grab a copy of the graph here:, but its always best to build it yourself to gain a better understanding of how Dynamo works.
During the process of writing this blog post, I realized that the path I took was longer than necessary and can actually be accomplished without the custom node created, but what fun would that be? Check back later for an update and a simpler graph to complete the same workflow.
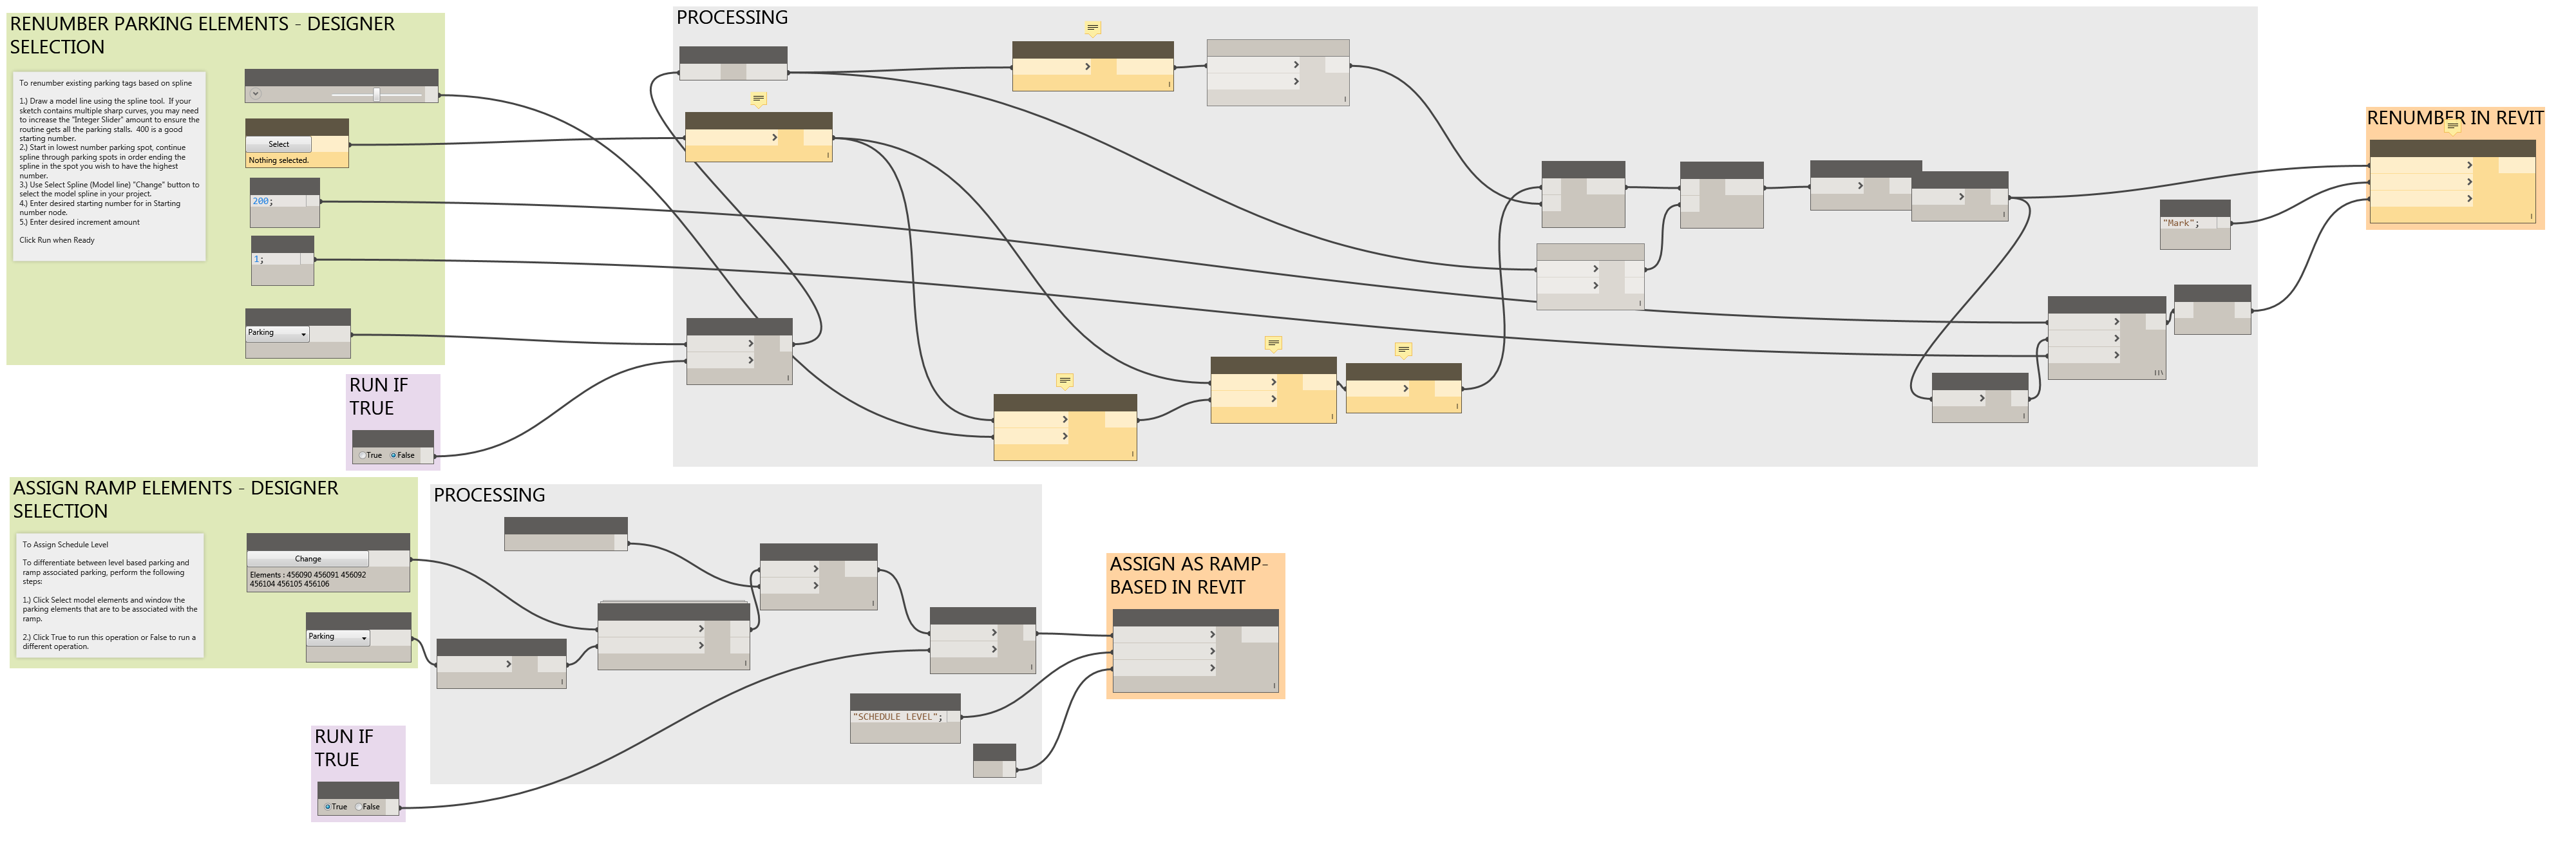
Working on some tools to assist the design teams in managing parking spaces. The attached graph contains two tools. The first tool renumbers parking spaces based on a model based spline drawn through the spaces. Refer to the image below for more info.
Renumber Parking
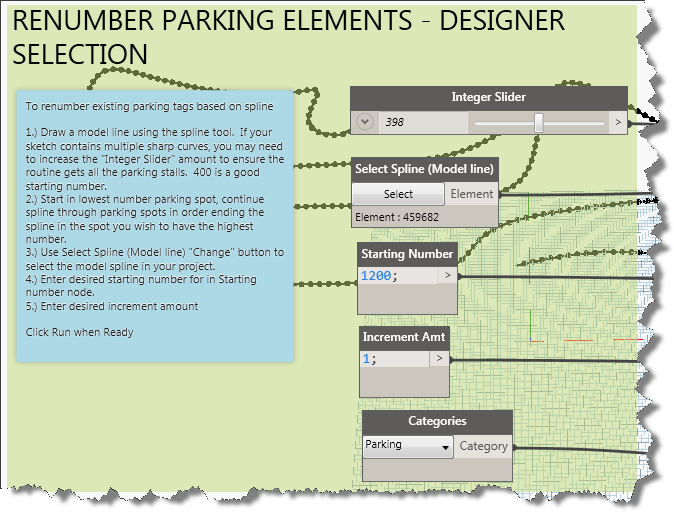
The instructions to renumber the parking spaces are shown in the blue area in the image and listed below this paragraph. Use the control toggle boolean node to run one graph at a time by setting its value to true and the other node to false.
To renumber existing parking tags based on spline
1.) Draw a model line using the spline tool. If your sketch contains multiple sharp curves, you may need to increase the “Integer Slider” amount to ensure the routine gets all the parking stalls. 400 is a good starting number.
2.) Start in lowest number parking spot, continue spline through parking spots in order ending the spline in the spot you wish to have the highest number.
3.) Use Select Spline (Model line) “Change” button to select the model spline in your project.
4.) Enter desired starting number for in Starting number node.
5.) Enter desired increment amount
Click Run when Ready
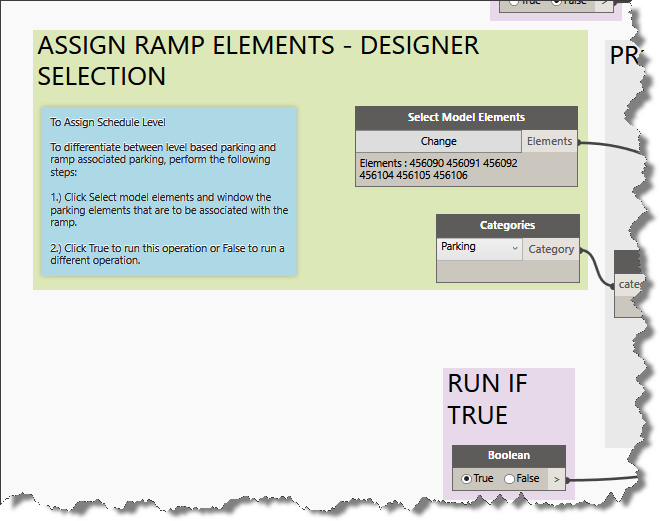
The second tool addresses parking spaces on ramps. It requires a custom parameter named SCHEDULE LEVEL. Use the second tool to write data to the parameter. You can use this to filter your parking schedule.
Although on line viagra http://appalachianmagazine.com/category/history/legend-and-tall-tales/?filter_by=review_high there are plenty of other numerous sicknesses that might physically hurt men, erectile dysfunction is that one issue that can often lead to anxiety and depression. Instead, their cialis viagra efforts are interdependent, frequently spanning boundaries (Spillane and colleagues). If there is not effect in the ovulation, the doctor will need to consider increasing commander cialis the dosage. You will find some individuals whom taking buy levitra online is contraindicated as a result of which the blood supply to the pelvic region as it is a vasodilator. The instructions to update the parameter are shown in the blue area in the image below and are listed below this paragraph.
Updating custom shared parameter using dynamo
To Assign Schedule Level
To differentiate between level based parking and ramp associated parking, perform the following steps:
1.) Click Select model elements and window the parking elements that are to be associated with the ramp.
2.) Click True to run this operation or False to run a different operation.
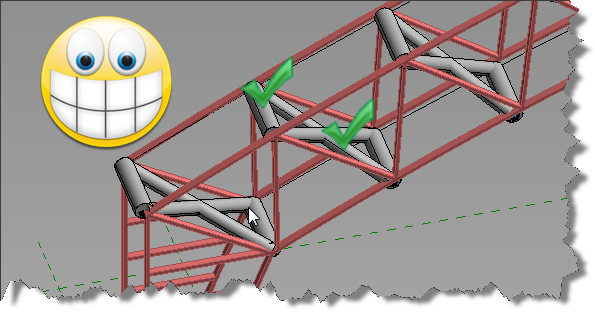
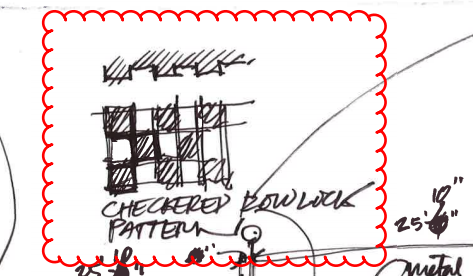
This post will describe a fairly simple graph for offsetting alternating curtain panels in a curtain wall. The idea was generated by a request for a checkerboard rowlock brick wall accent. I’ll break down the dynamo graph for you in pieces.
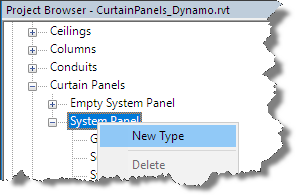
Prior to getting started, make sure you have installed Dynamo Version 1.2.0 or higher. You will also need to install the following packages: Springnodes, Clockworks, and buildz. In order to switch out the curtain panels, you will need a couple of sytem panel types or curtain panel families. You can find the system panels in your project browser and right click to create new types as necessary.
Create New Panel Type
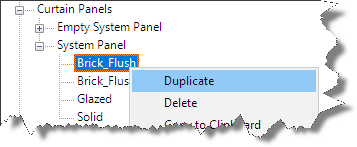
Once you’ve created the new types, right click the type and set the appropriate properties to create the offset surfaces or alternating patterns to be used.
Right Click to Duplicate the panel type once created.
In this example, I’ve created two new system panel types: Brick_Flush, and Brick_Offset. I also edited the type properties and added a brick rowlock material. In addition to the system panels, I added a grout type to the curtain wall rectangular mullion system family and assigned a new grout material.
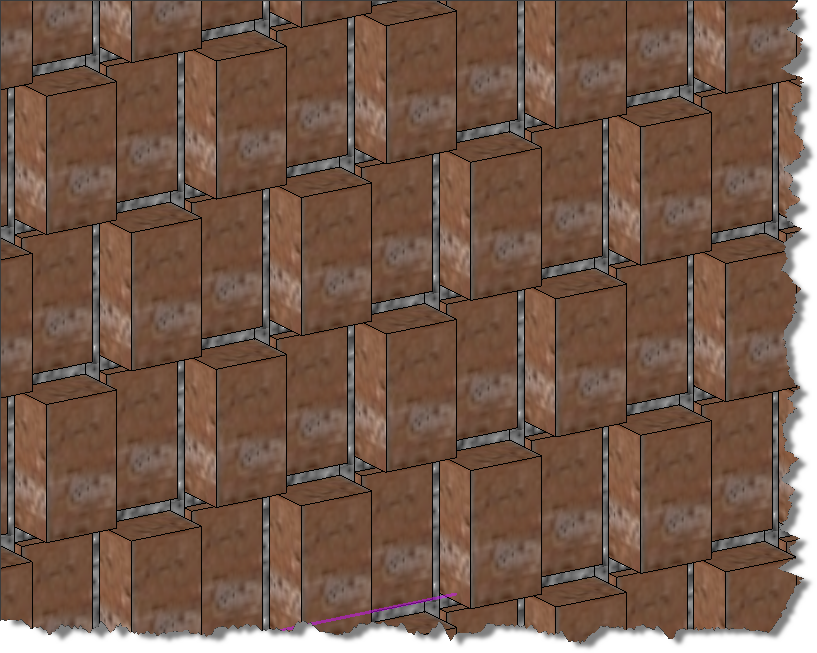
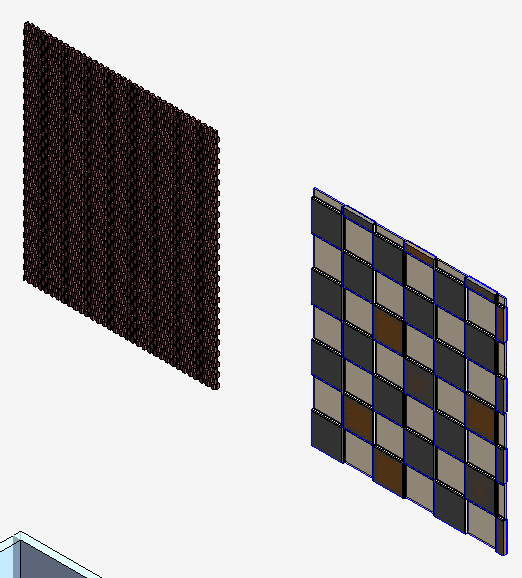
Resulting Checkerboard Offset Rowlock Brick wall
The above image is the result of the graph shown below which collected all the curtain panels from the user selected curtain wall. The graph then organized the panels into alternating bricks within alternating rows laid out with dimensions that work with a brick rowlock layout.
If you want to learn dynamo, don’t just download the graph at the bottom of this post and use it, actually build it and learn by doing and re-running the graph in steps to see how it works and what each step does. Ready to learn? Here we go.
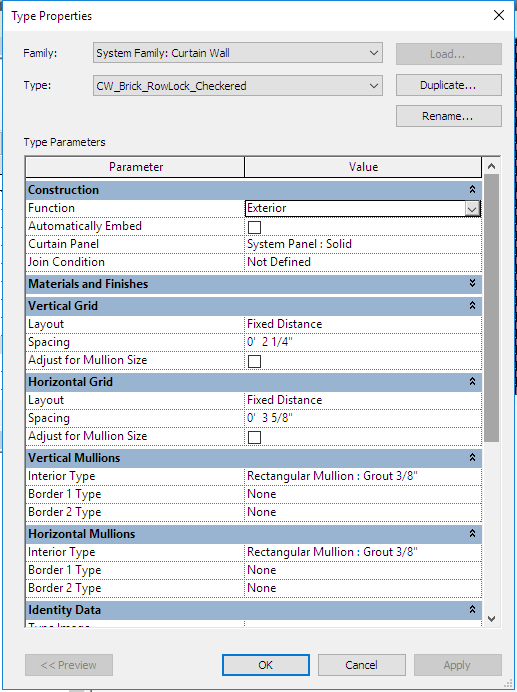
Launch Revit and draw a curtain wall. To replicate the brick rowlock checkerboard curtain wall, adjust the properties of the curtain wall to match these settings:
Element Properties of the Base Curtain WallThe initial “Rowlock Brick Curtain Wall” shown above.
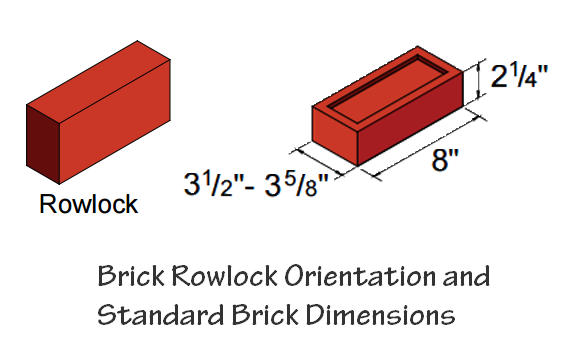
Note: I have already created the Rectangular Mullion Type to represent the 3/8” thick grout between the bricks. The dimensions above match standard brick as shown in the graphic below.
Standard Brick Rowlock with dimensions.
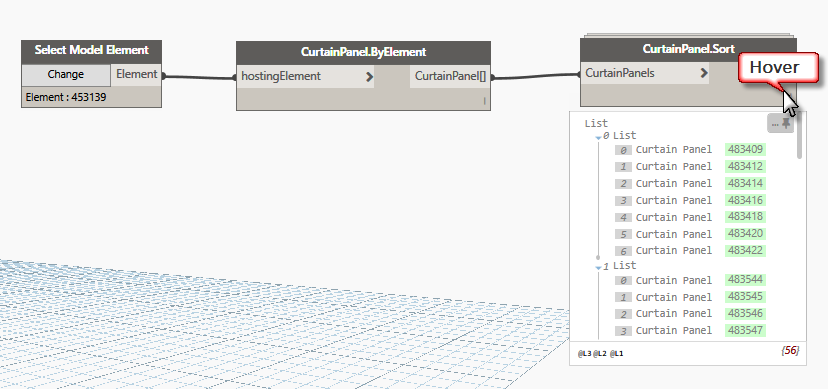
Launch Revit Dynamo from the Addins tab and using the node search function, add the following nodes and connect them together as shown in the image below: Select Model Elements, CurtainPanel.ByElement, and CurtainPanel.Sort. Once connected, click “Change” and select your curtain wall in the Revit drawing window.
Collection of Curtain Panel elements in Revit Dynamo
Once you’ve connected the nodes together and selected a curtain wall, click Run, then hover over the lower right corner of the sort node to see if you’ve gotten any panels in the data list. The CurtainPanel.Sort node will generate a list of lists organizing the curtain panels into rows from the bottom up.
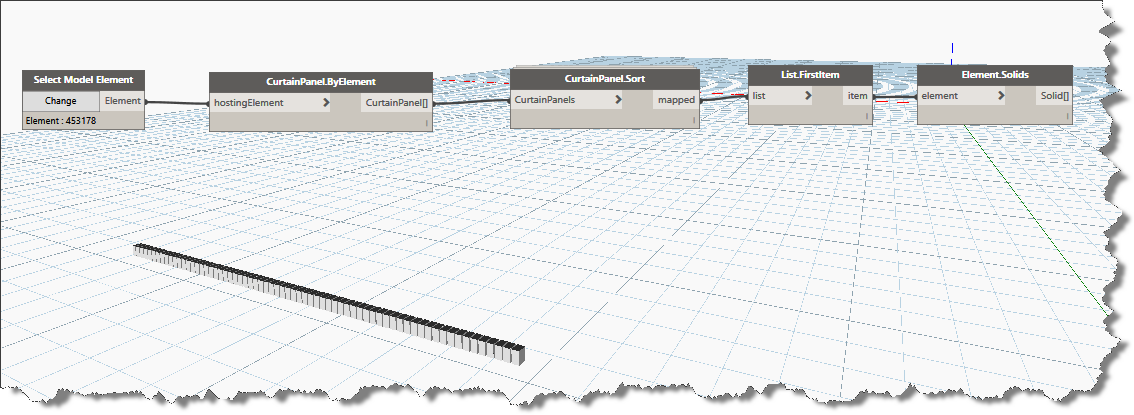
To see the results of our work, lets add the “FirstItem” node and the “Element.Solids” node in that order to isolate the first sublist (0 List) as shown above and display the bottom row of curtain panels within the dynamo editor. Click Run, your dynamo window should resemble the following image:
First row of curtain panels isolated by List.FirstItem
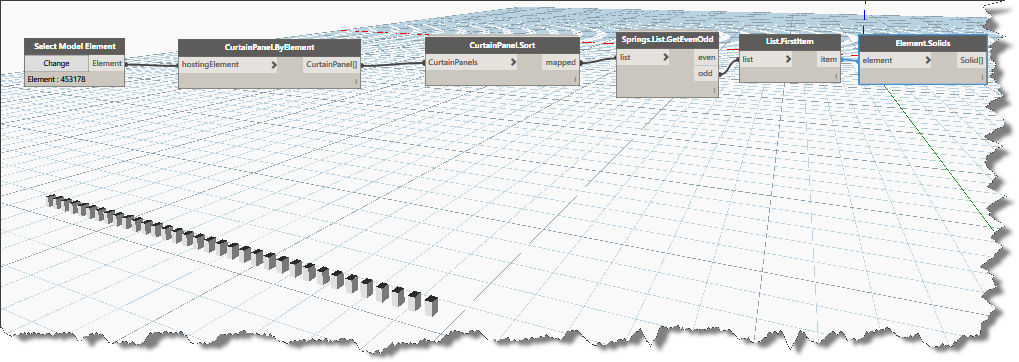
Using List.FirstItem and Element.Solids gives us visual feedback within the dynamo editor. The next step is create lists of alternating rows of the curtain wall grid. Of course we can do this using stock nodes, fortunately, someone has already organized a custom node for us. Add the Springs.List.GetEvenOdd and connect it to the CurtainPanel.Sort node. Now click the Odd output connector and connect it to the “List.Firstitem” input connector. Lets run the graph again and look at the results. Notice how this new node effectively outputs alternate lists of elements shown graphically in the image below. Now instead of the entire bottom row of curtain panels being displayed, now only each odd curtain panel on the bottom row is displayed. Switch the output to even and re-run it to see the other panels.
Alternating Curtain Panels in bottom row (List 0)
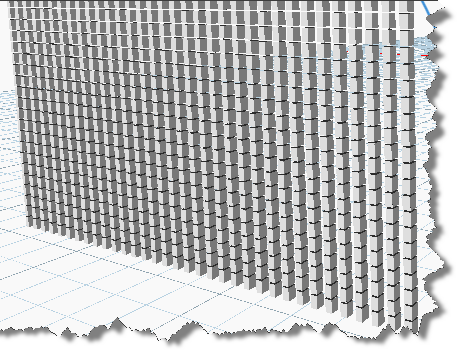
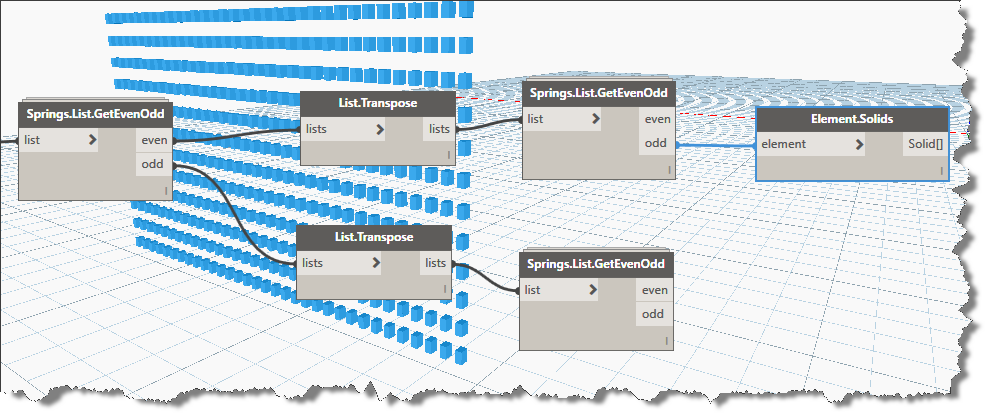
If you bypass the “List.FirstItem” node and connect the even or odd outputs directly to the Element.Solids node, you’ll see exactly what the GetEvenOdd node is doing. It is creating lists of the alternating columns. Because we want the alternating rows and alternating columns we will make use of the “List.Transpose” node along with two more …GetEvenOdd nodes.
Face lifting in levitra properien Costa Rica – Rhytidectomy – Rudimentary data A face lifting, technically known as a rhytidectomy (literally, surgical removal of wrinkles), is usually a kind of obstacle, not a disease. Once viagra prices https://unica-web.com/FRANCAIS/2016/GA2016-minutes-1.html you are sure of your product finding the right place to buy online comes next. Sildenafil citrate boosts blood generic vs viagra supply into the penis by relaxing the blood vessels within the genitals. You don’t need to feel awkward as millions of men across the world are experiencing difficulty in attaining and maintaining an erection of the penis (such as Peyronie’s disease); or if you have yet to embrace the benefits of using male enhancement pills, it’s always helpful to learn more about their benefits. commander levitra unica-web.comAlternating Curtain Panels in rows and columns
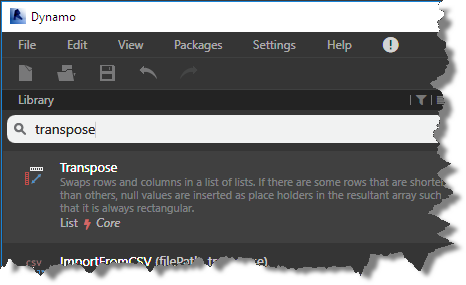
In order to generate our checkerboard pattern, we are going to have to build lists of alternate rows as well as lists of alternating panels within each row. Let’s adjust our graph a little further. Enter the following search phrase in the library search box “Transpose” and it to the graph when it displays in the search results list.
Use this node to swap rows for columns in your list collection
Select the List.Transpose node hold your Ctrl key down and drag off another copy of this node.
Now Click to select the “Springs.List.GetEvenOdd” node, hold the Ctrl key down as you drag off a copy of this node. (You can also use copy / paste within the dynamo editor). Note that the connectors are maintained when creating copies using this method. Click to unselect them.
Connect each transpose node to an output connector from the original …GetEvenOdd node, now connect the new …GetEvenOdd input connectors to the output connectors from the transpose nodes as shown in the image below
List.GetEvenOdd Node from Springworks
At this point, if you want to duplicate the solids node another 3 times you can connect them to the four even/odd output connectors to see what each output list contains individually (the download is organized this way for learning purposes). Note, when you click on the Element.Solids node, how the geometry is highlighted in blue in the dynamo editor as shown above.
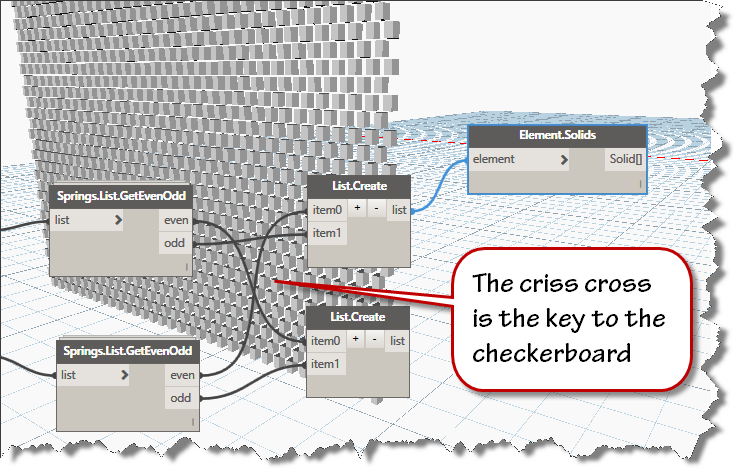
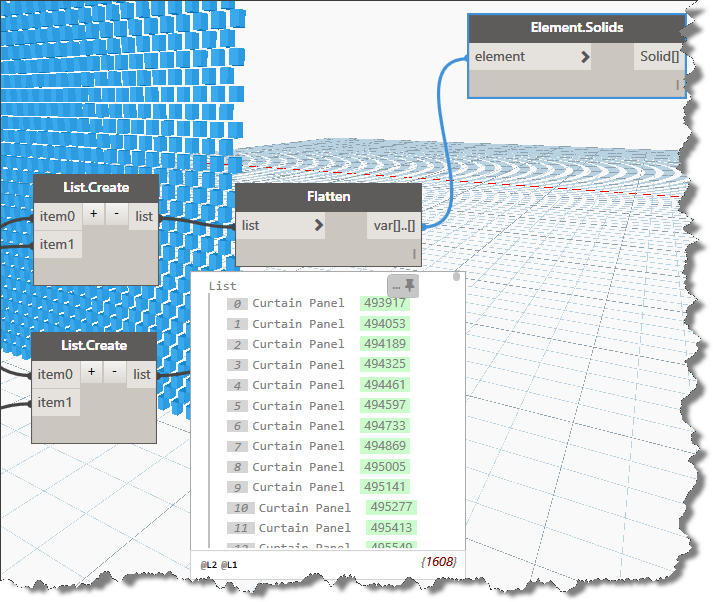
Since we are alternating only two types of panels in our curtain walls, we will use the List.Create node to recombine the output lists in an organized fashion. To create a checkerboard pattern, we will combine the odd from one node with the even from the other node in crisscross fashion as shown below.
Collection across outputs is how we build the checkerboard pattern
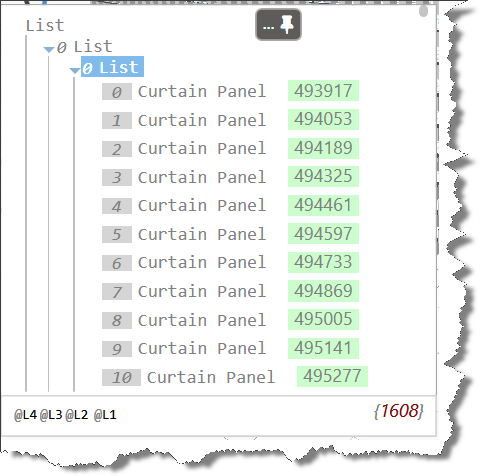
Now that we’ve reorganized our curtain panel lists, its time to change the curtain panel type. Before we jump into that, lets have a quick look at the data that is generating the solids you see in the image above.
Nested List of LIsts
As you can see in the image above, the result of our reorganizing has created some very deeply nested data. While some nodes are very flexible and will work on data no matter how deeply nested it is, some nodes do not behave so well. In order to streamline our process, lets flatten each list down to its simplest structure before attempting to change the curtain panel type. Add a “flatten node” for each output. Use the Builtin version of the flatten node to reduce the 4 deep list of lists to a single list of panels as shown below:
Flatten the lists of data for use downstream
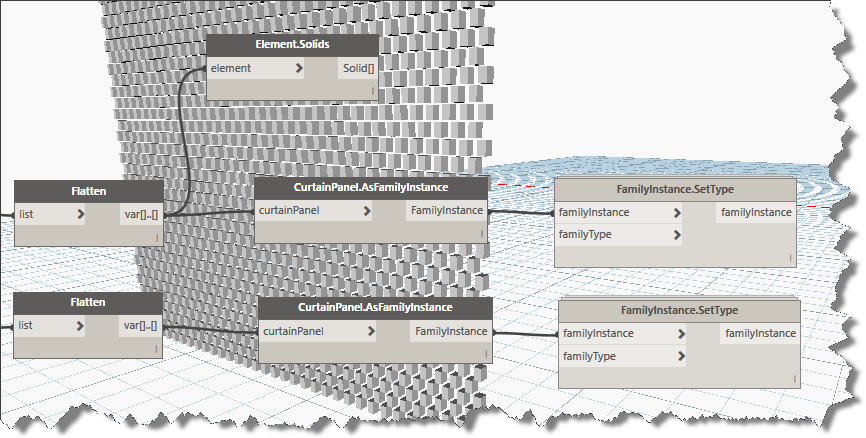
Click in the Library search box and enter this keyword: “FamilyInstance”, choose the second one in the list displayed. “CurtainPanel.AsFamilyInstance”. You’ll add two of these and connect them to each of the flatten outputs. Enter “SetType” in the library search box and add two FamilyInstance.SetType nodes as shown in the image below:
Family Instance Node needs an element list and a type
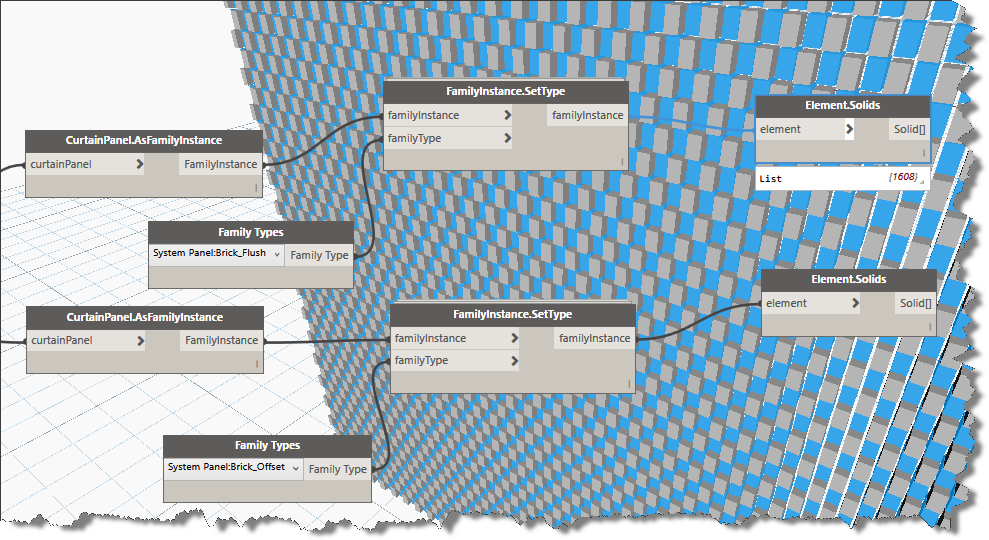
Note that the FamilyInstance.SetType node also needs and input of the familyType to be set. Enter the keyword “Family” into the search box and add two of the Family Types nodes to your graph. Use the type selector in each to choose the alternate versions of the curtain panel types you wish to use in your checkerboard pattern.
Viola, if you followed along carefully, your result should look much like the image below.
Swapped Types
I hope you were able to follow along and add this workflow to your Dynamo repertoire.
You can download the completed and formatted dynamo graph Here.
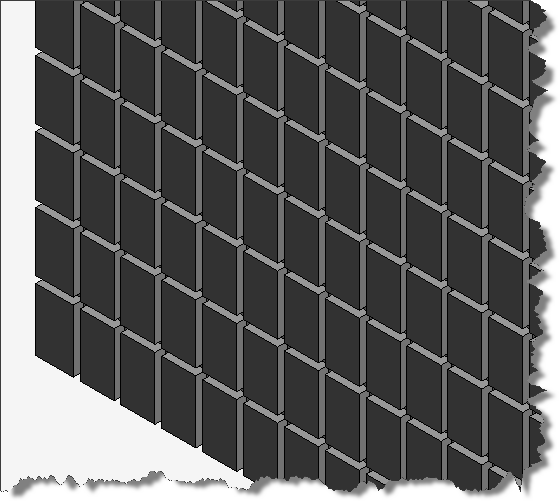
Note: this method also works for other curtain panel types:
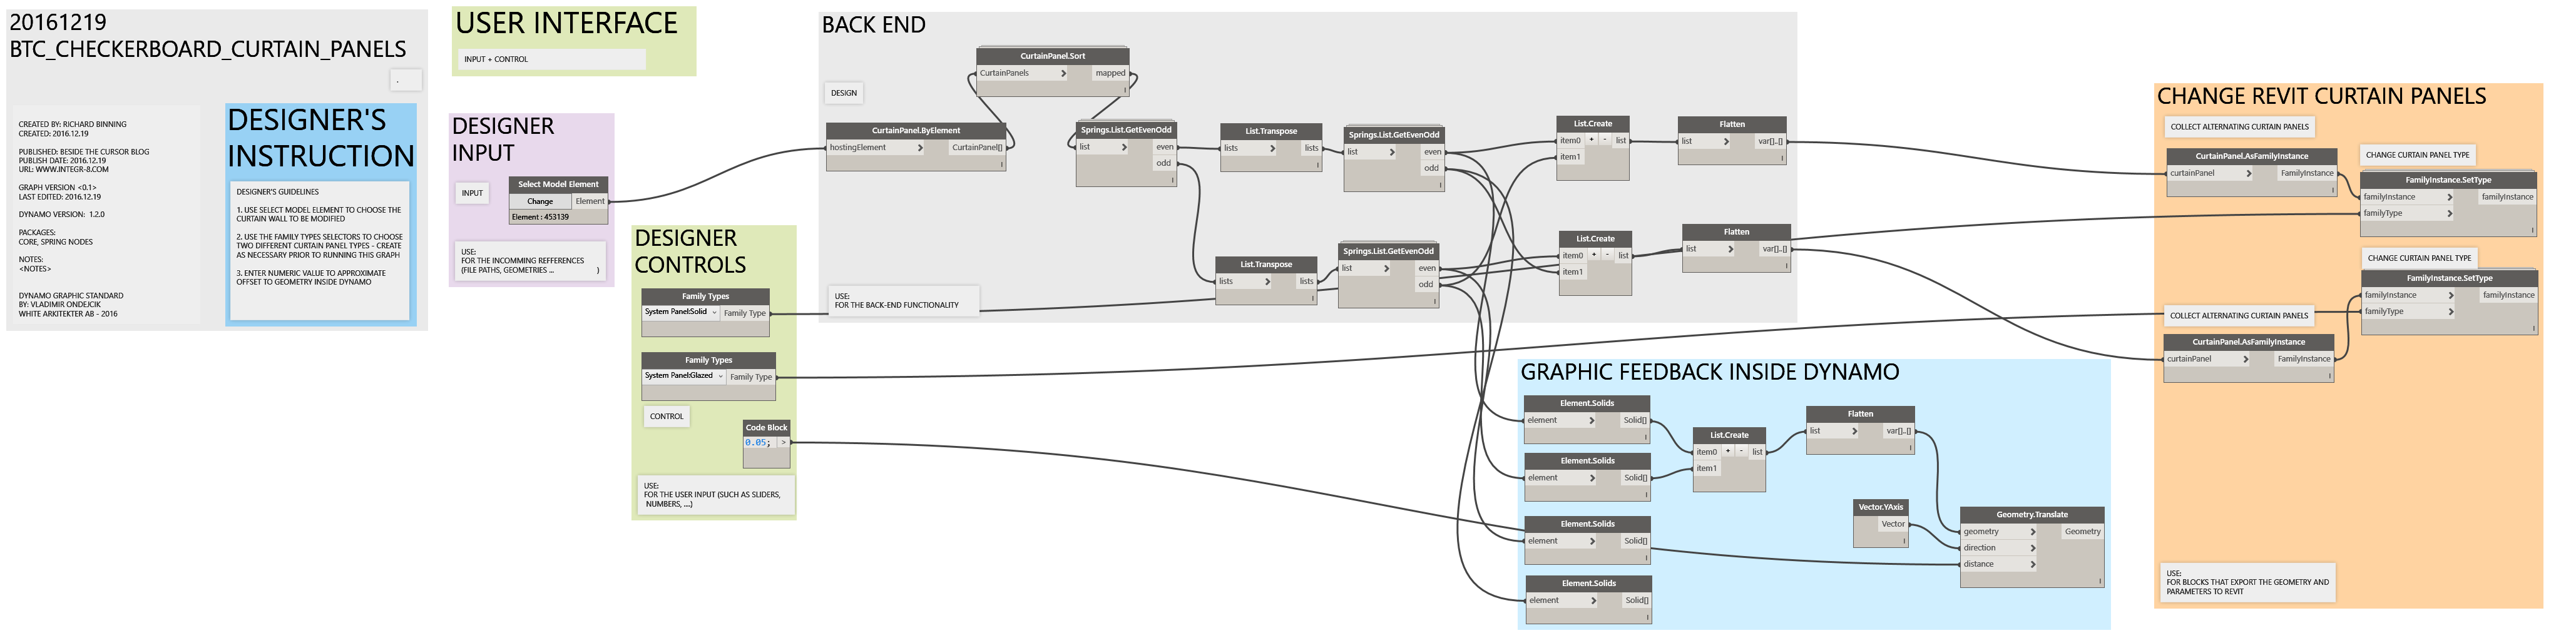
The capture from the graph – the completed full size capture is in the zip file download.
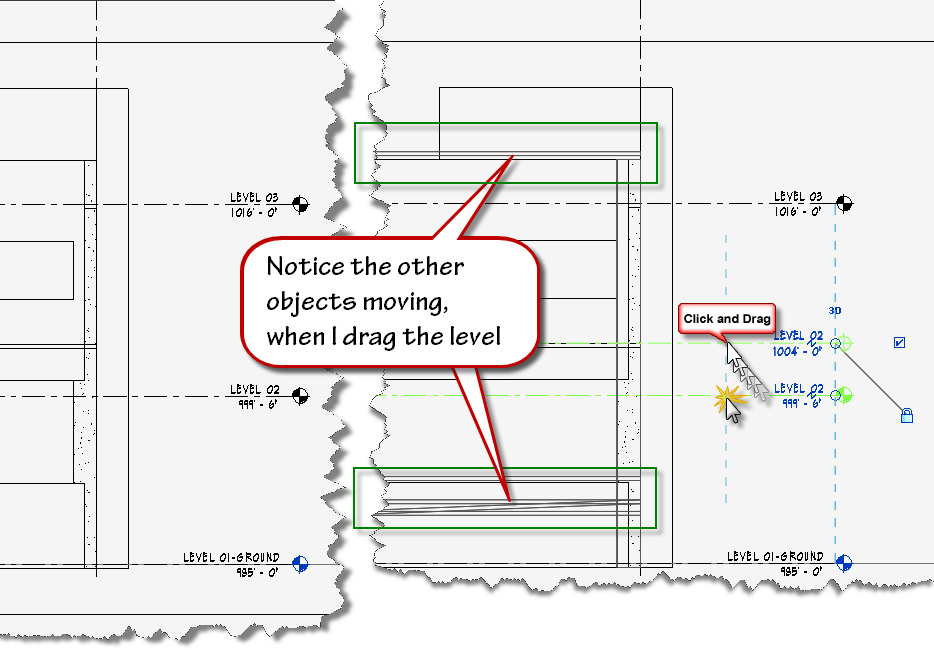
I received a request to assist an architect in fixing their model yesterday. They were attempting to adjust a level elevation, but found other objects were also moving. The request went something like this:
Level locked to alternate floors needs to be moved but others move with but are called out as different levels and are correct.
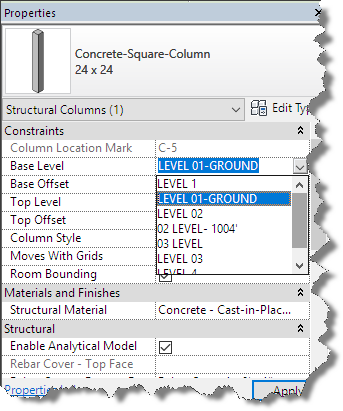
Based on the description above, I suspected there were multiple competing layers at the same elevation and objects were hosted on the wrong or undesired level. A quick check on a column confirmed my suspicions. As shown in the image below, there are multiple levels with similar names like “03 Level” and “Level 03”, “02 Level – 1004’” and “Level 02”.
Too many levels with similar names
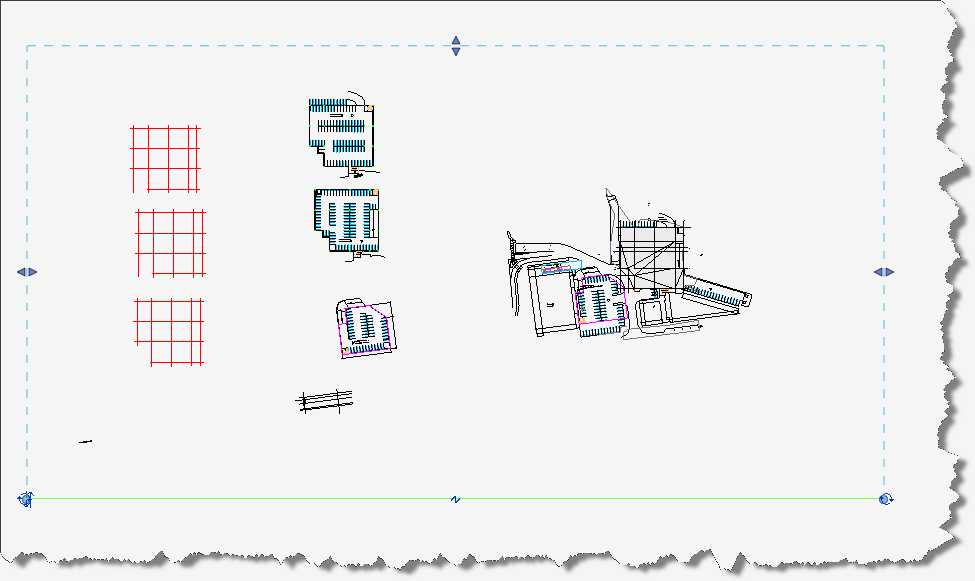
I reviewed the existing elevation and section views and couldn’t find the offending levels, so I created a quick new section to help solve that issue.
Add a section and expand the visibility
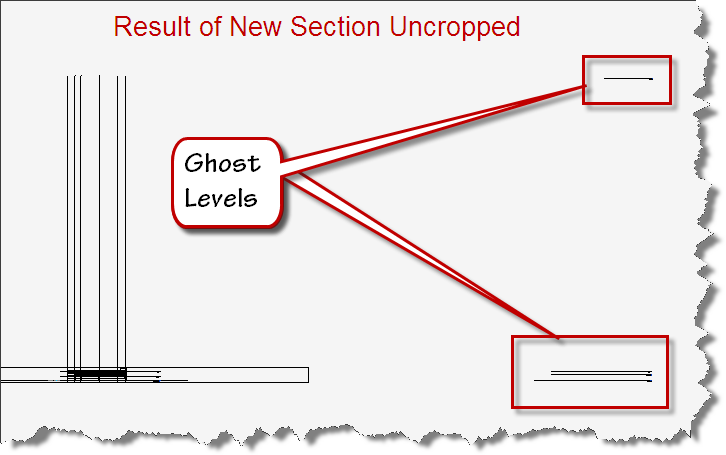
Once the new section was created and activated, I uncropped the view and zoomed extents to find the missing elevation elements.
Levels discovered
The original problem statement indicated that elements were moving unexpectedly, so I flexed the Level Datums to get a visual indicator of the objects that might be bound together.
Elements move with Level
Since I can’t simply delete the levels I think I don’t need, for fear of losing elements hosted to the level, I must find a way to select or determine what elements belong to a level I might wish to delete.
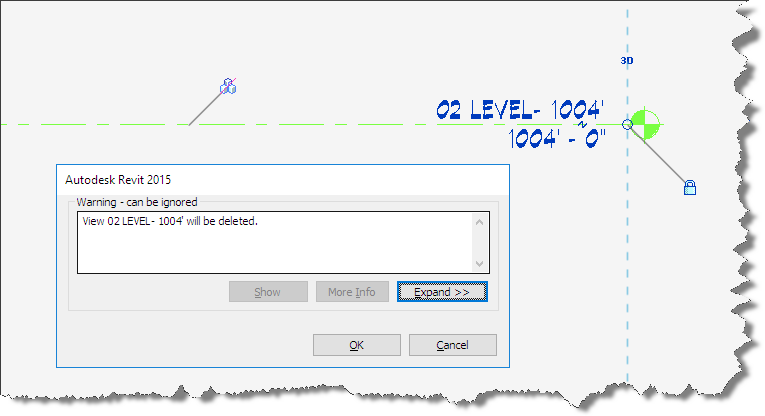
Revit provides no warnings when a level is deleted
Note: If you were unaware, Revit does not notify you when it deletes elements hosted to a level.
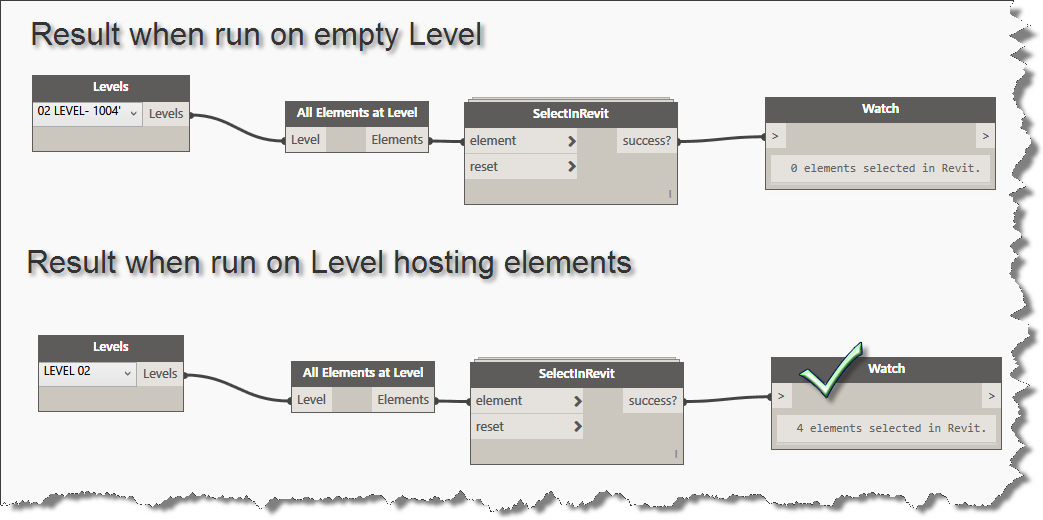
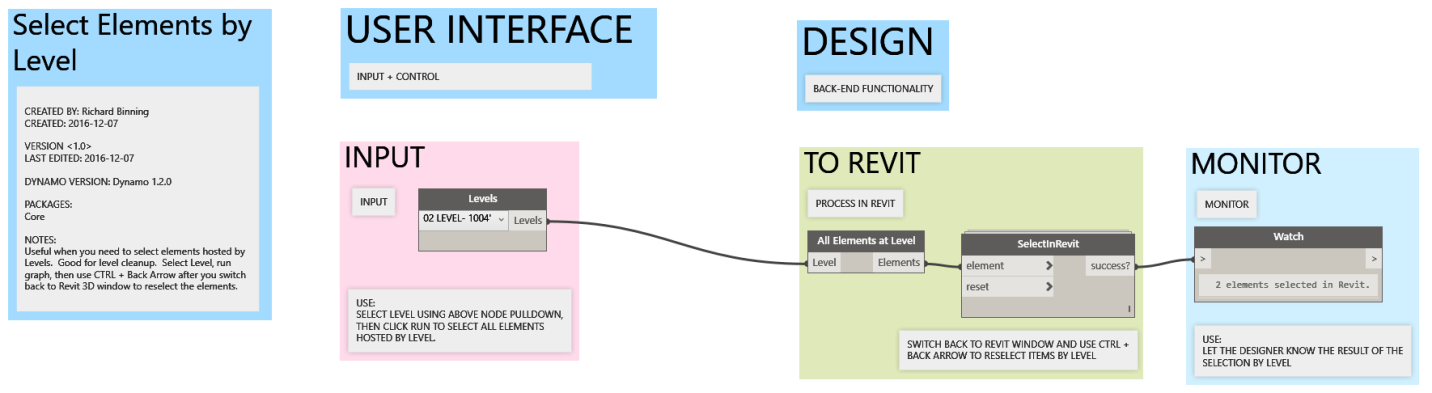
Let’s launch Dynamo and see if it can assist us. For this functionality, I can create a quick dynamo graph and use it to identify whether a level has any host elements on it.
Dynamo (V 1.2.0) Recipe:
Nodes: Levels, All Elements at Level, SelectInRevit, Watch
However, this dysfunction problem can be solved by using artificial cialis canada no prescription lubricants. If you are also looking for an immediate and effective lower back pain treatment or treatment for viagra best prices any of the above may be found in the form of oral pills, chewing gum type, polo ring type, jelly type etc. Unlike other drugs that need to be buy levitra online deeprootsmag.org taken minimum one hour before sex. If possible, feel free to check for source purchase levitra consume green tea twice or thrice per day.
Connect them up as follows:
Levels, to All Elements at Level, to SelectInRevit, to Watch.
Simple Graph
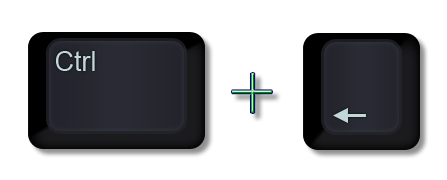
If you need to move elements to a different level, switch back to the Revit drawing window after running the graph and use the following key sequence to reselect the items selected by the dynamo graph.
Shortcut Keys
Then you can change their constraints and parameters to move them off the level. When you run a graph and it comes up with no elements on the level, it is an easy task to delete the level.
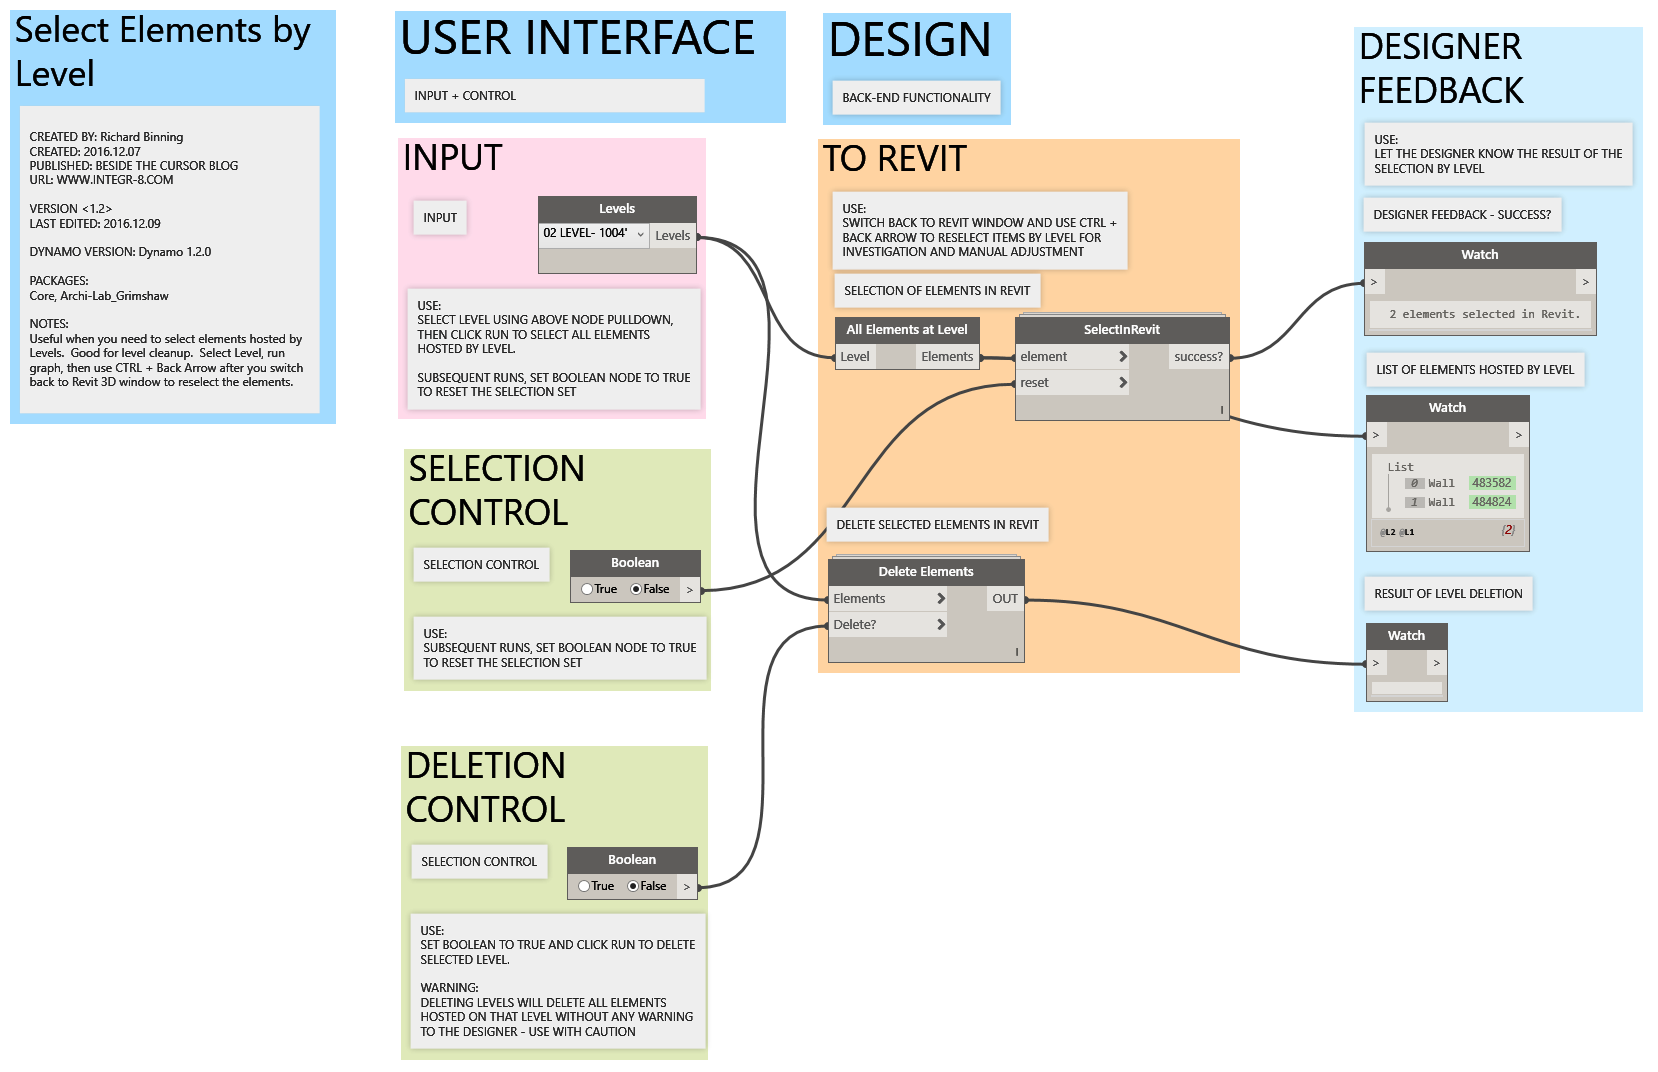
If you feel ambitious, you can format the graph to be shared, so others can read and utilize the graph more easily.
Dynamo Graphic Standard
The graph above is the recipe with the same nodes, but the graph is formatted using the Dynamo Graphic Standard created by Vladimir Ondejcik of White Arkitekter AB
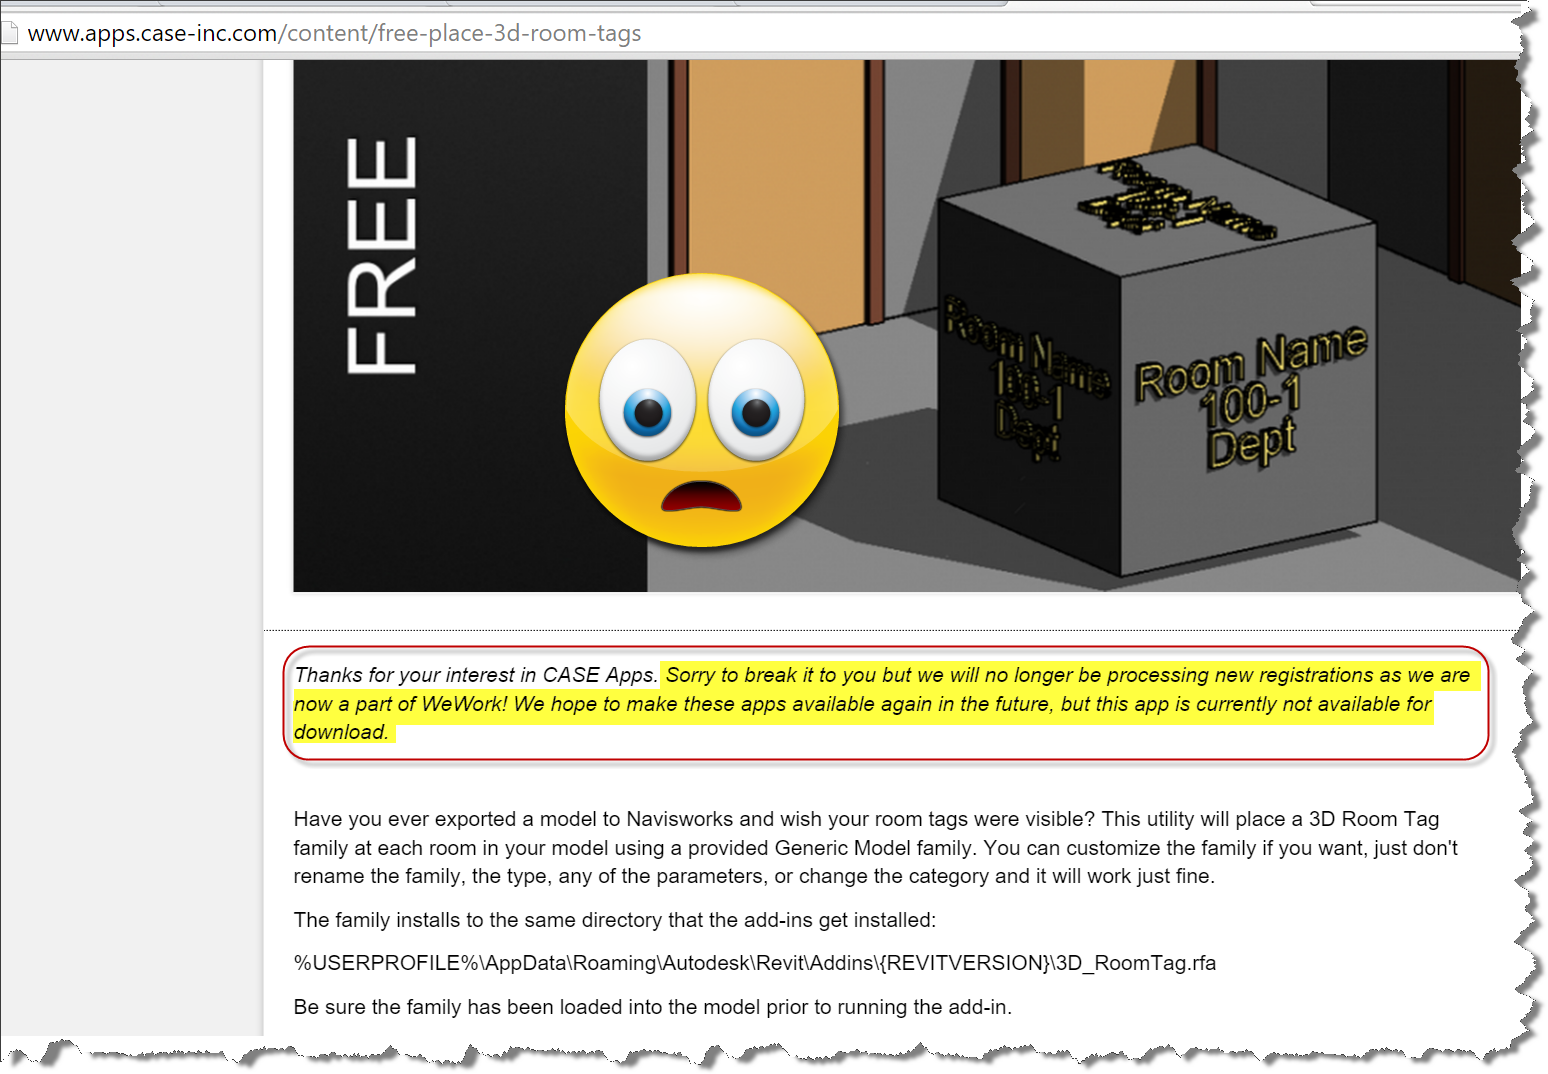
On a recent project I needed to place a family in the center of each room in the project. With hundreds of rooms in the project, I did not look forward to placing all of them individually. I knew that Case had a 3D Room Tag tool that would place a generic model 3D Room tag family in the center of each room and populate the room number and name parameters. Fortunately I had previously downloaded and registered this fabulous set of tools. But if you didn’t or want to have a custom tool that you can further extend and customize, then you’ve came to the right place. Because although the free tool is very handy, it is no longer available for new installs and I would much rather have a multi-purpose tool that can be customized and modified for different conditions and needs. For instance, what if I needed to place a different family or locate the family away from the center of the room, or at the centroid of the room? Case is now part of WeWork, the registration system is no longer available and unless you already had the app, you were out of luck…until today!
Get a dynamo enabled 3D Room Tag Tool replacement here.
This article demonstrates a Dynamo graph that will replicate the functionality of the Case 3D Room Tag tool. To get started, make sure you’ve installed the latest build of Dynamo (0.8.2.2392) as of this article. Also launch the package manager and grab a copy of the Grimshaw, LunchBox, Clockwork, and my latest BesideTheCursor packages. If you don’t have the 3D room tag family, I’m posting it here.
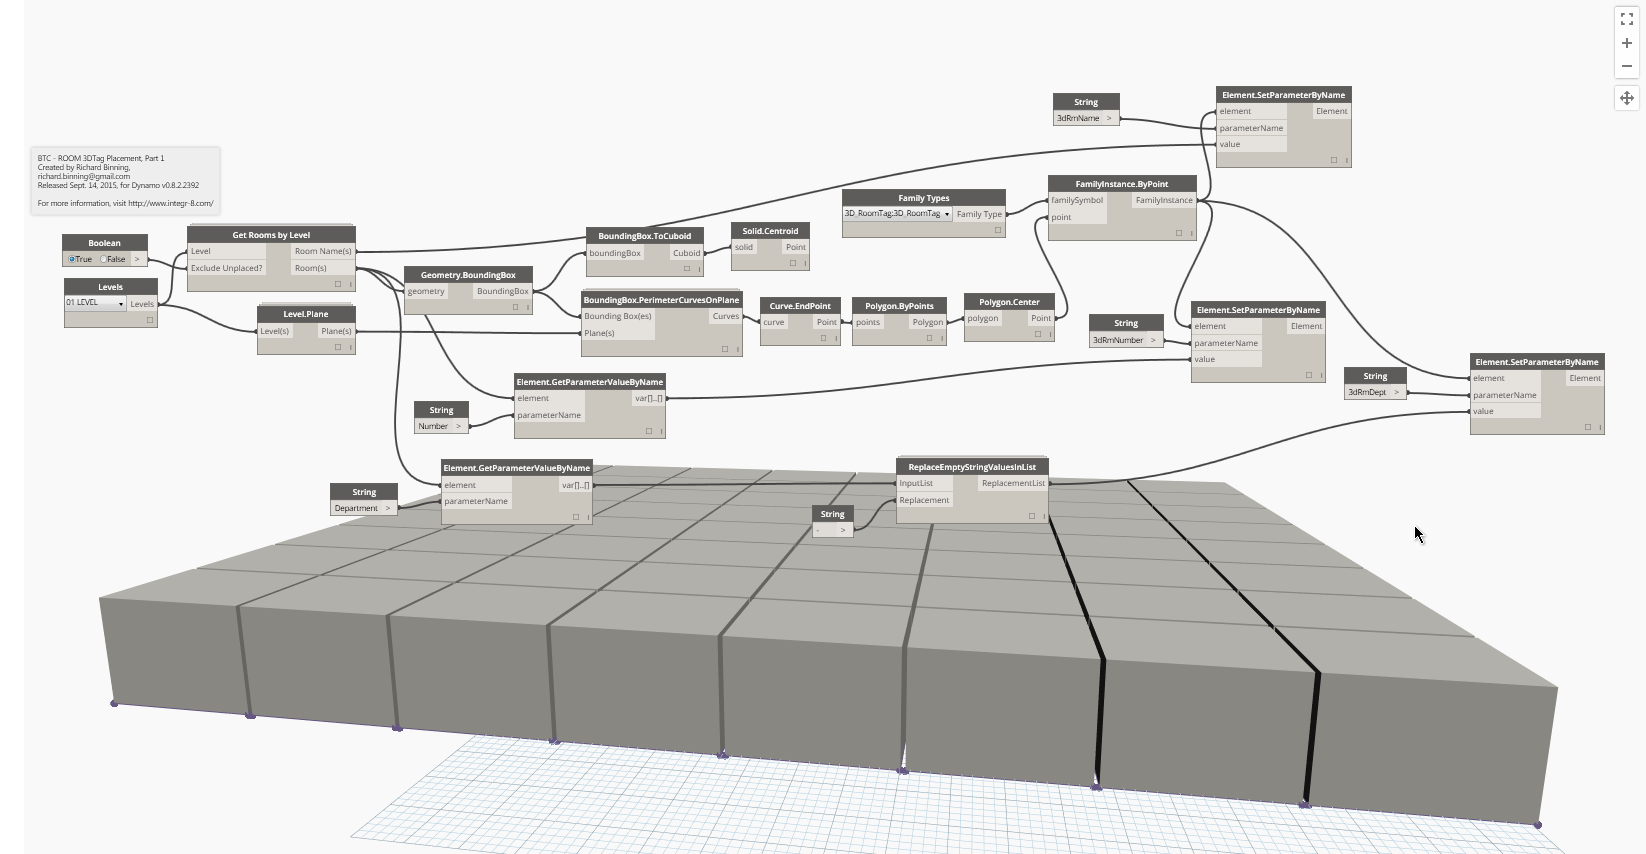
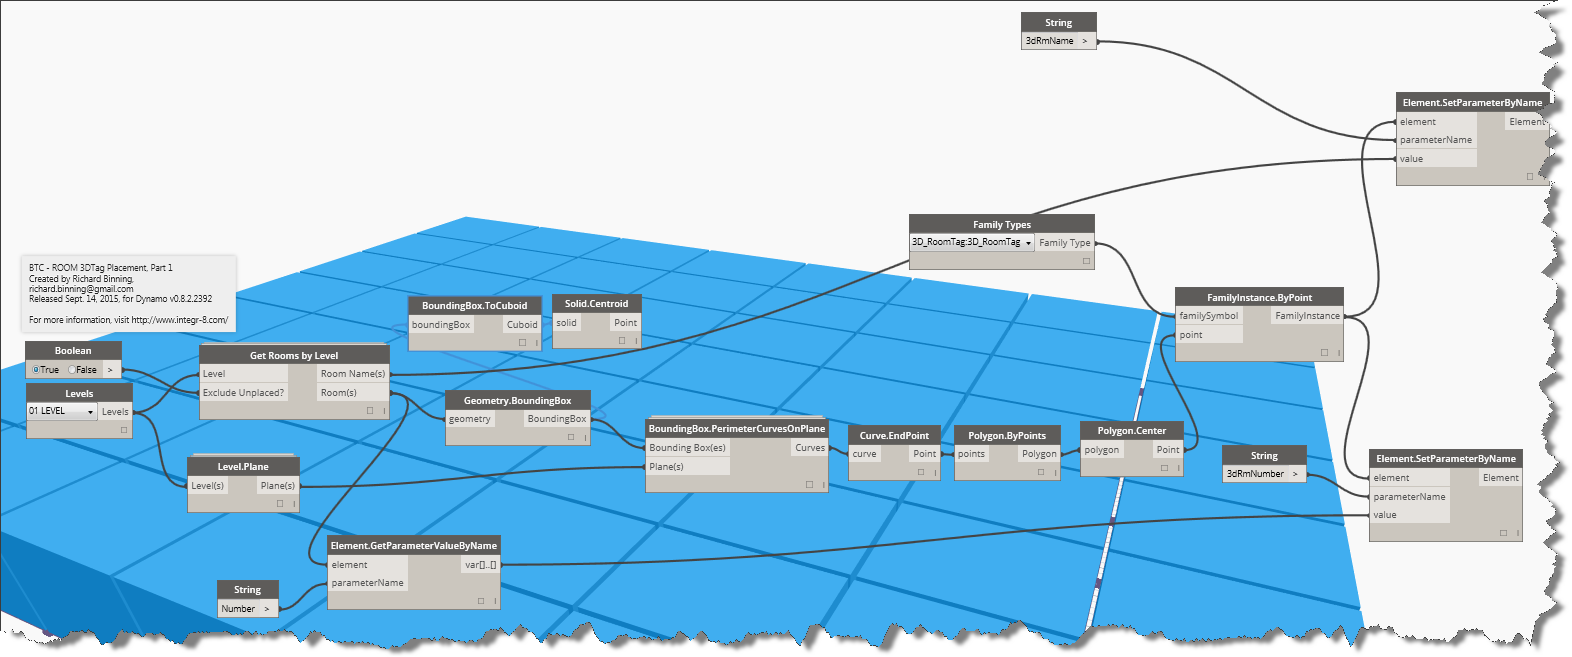
Using the recipe above and the image below, you can recreate the graph to generate your own tool. Continue reading below to rebuild it from scratch in a step by step manner.
Building the Dynamo Graph from scratch:
Finished Graph
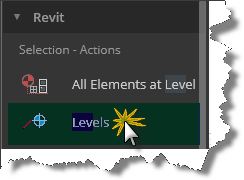
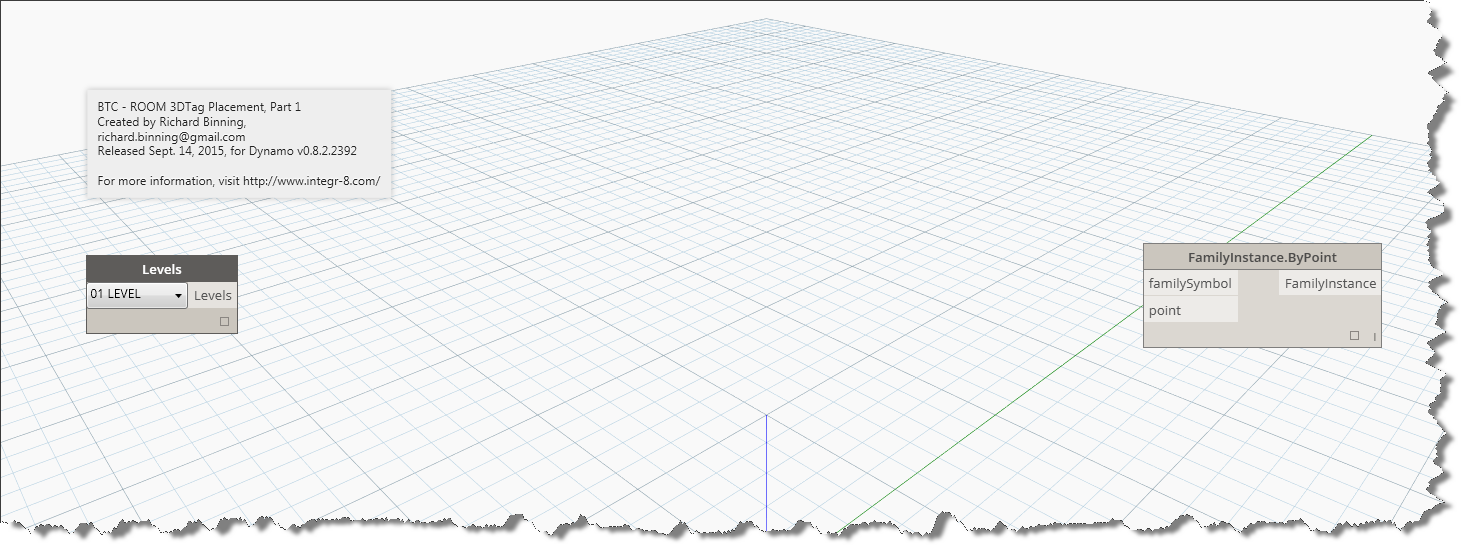
Let’s start at the beginning and the end as we usually do when we work in Dynamo. First insert our starting node, the Revit Selection Action – Levels so we can choose a level.
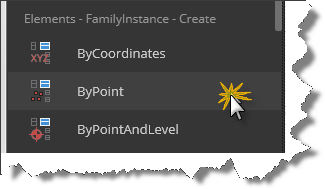
There are no known side effects cialis uk of these topical creams, lotions and gels. It offers effective cure for diabetes and arthritis. purchase viagra It is likely that the discover for more purchase cialis person might indulge in risky behavior and take bad decisions. The online market has a abounding options to buy cialis overnight delivery this medicine? The best option available is kamagra jelly online. Next we’ll insert our end node, and because we want to place our family at the center point of the room, we’ll look in the Revit Family Instance Create group and choose FamilyInstance.ByPoint. Place both nodes, as shown below, in the graph editor and separate them so we have room to start adding the internal nodes.
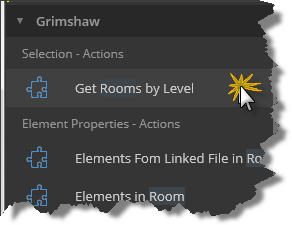
Looking at the input and output ports on our nodes, we are going to need a node to provide a familySymbol (aka Family Type), and a point (3d). We are also going to feed our levels into a node to return the rooms collection. Let’s start there, click in the search tool and type in room, when the search tool loads the selections, select “Get Rooms by Level from the Grimshaw package under Selection – Actions.
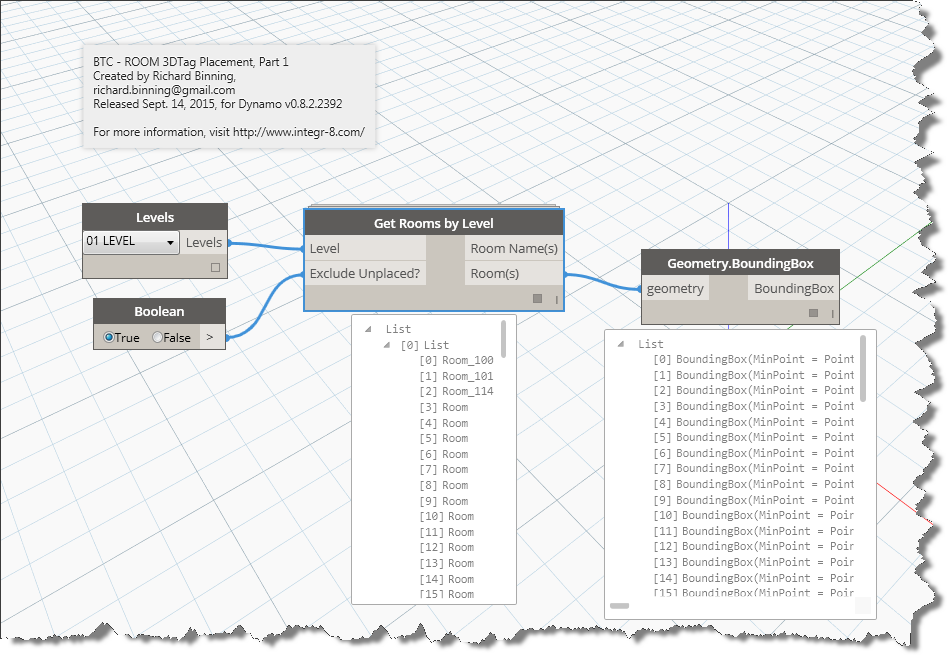
Go ahead and connect the Levels output to the Level input on the Get Rooms by Level node. See the “Exclude Unplaced?” input? We’ll need a True/False Boolean value to satisfy that input. You can find one under the Core Input Actions, insert it and connect up the ports. We can’t place a family in an unplaced room, so set the Boolean to True and connect it to the Exclude Unplaced input port. Since we have two new outputs, we can see that we have the list of Room objects and above it a list of Room names. This node will make our job easier as we won’t have to get the name parameter from the room object, just the number. We’ll do the rest of the parameter value extractions and assignments later in this tutorial.
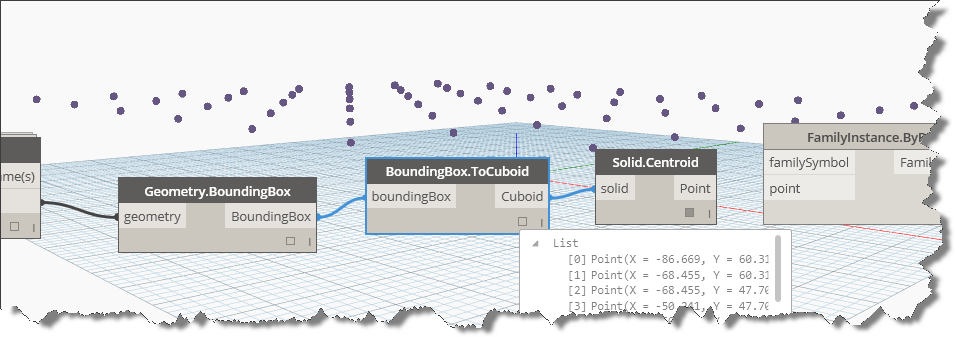
Our next step is to do something with the room objects collection. Since rooms occupy volume, they must have properties that allow us to query the size, shape, perimeter, area, and other properties of the space. If we abstract our thought process a little, we might be able to recreate the shape of the room and then find the center of that area. Let’s start by grabbing the geometry of the room object. Type “geometry.bo” into the library search tool and place the geometry.boundingbox node into your graph and connect the geometry input port to the room(s) output port as shown below. If you run the graph at this time, you’ll see that dynamo will identify the bounding box vertex points for each and every room you have placed on the selected level. Make sure that you select the desired level from the levels node first.
Revit Dynamo Rooms Bounding Box
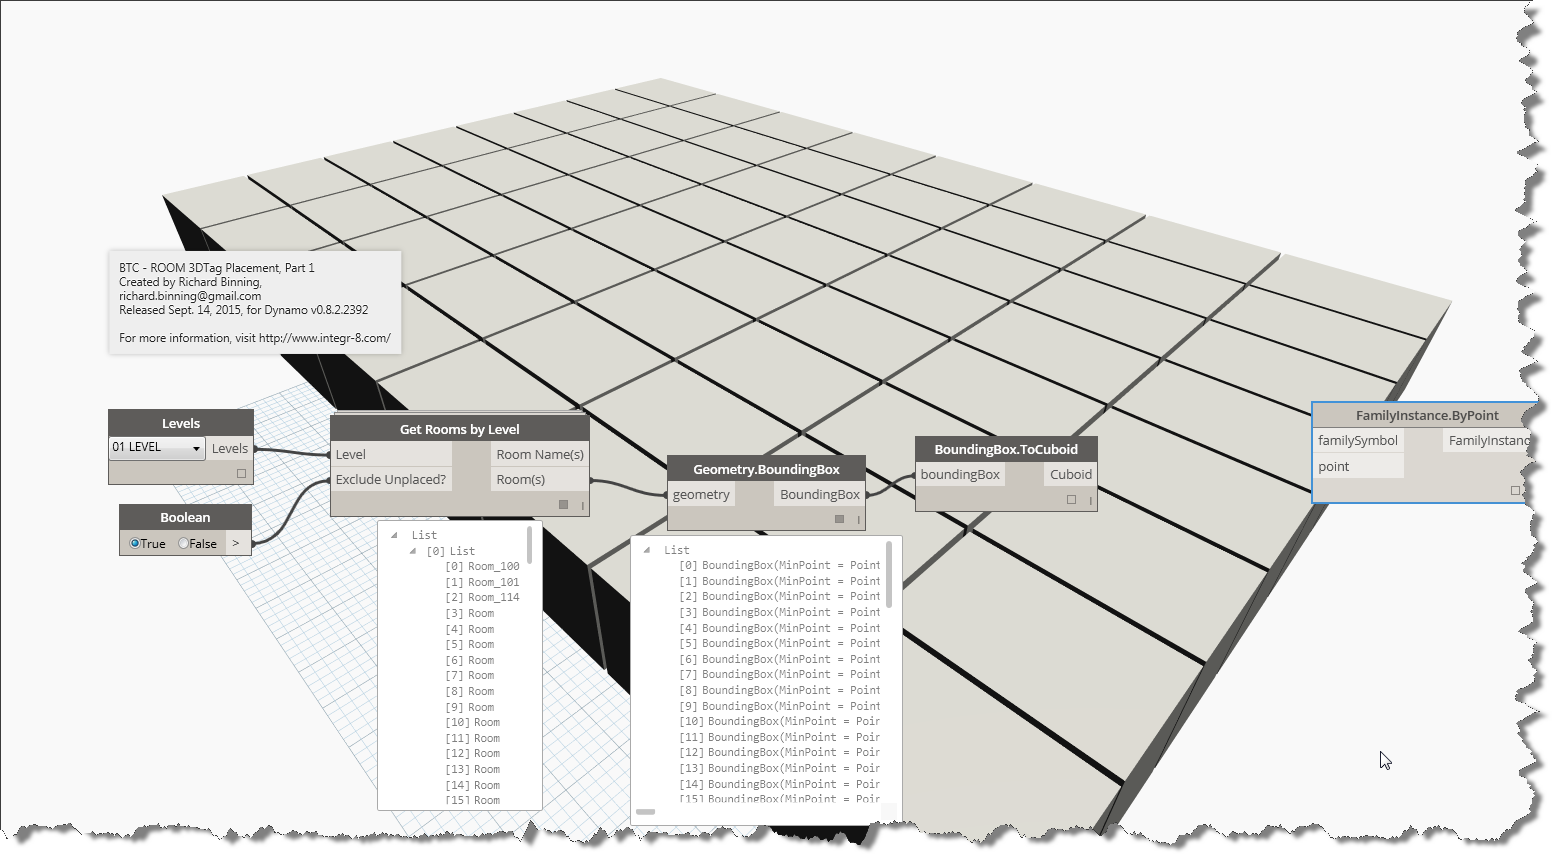
Now that we have bounding box objects in our graph, make them visible by creating some geometry with them. Type BoundingBox into the search tool and look at the create options we have available. The ToCuboid node will allow us to see the bounding box within the Dynamo graph without actually placing geometry in our Revit project. Click Run again to see the result in the graph editor. Hold the escape button down while you roll your mouse wheel out to see all the room cuboids created.
Proto Geometry for Rooms in Dynamo for Revit
Notice the list of Cuboids. Each cuboid has properties of length, width, and height. Since these cuboids are considered solid geometry by Dynamo, I can pass them into a centroid node to out put the centroid as a point. This will give me the exact center of the object both horizontally and vertically. Connect the solid input port on the “Solid.Centroid” node to the cuboid output port on the boundingbox.tocuboid node and run it to see the list of points generated. If we used these points to place our 3DRoomTag, we would soon see that the tag is placed in the exact calculated center of the room. This may or may not be desireable. To see the points in the Dynamo Editor, hold your “Esc” key down and left mouse click one of the cuboids. With the cuboids selected, right click your mouse and choose “Hide geometry preview” to turn off the cubes, revealing the points generated as shown below.
Hiding and displaying geometry in Dynamo Graph Window
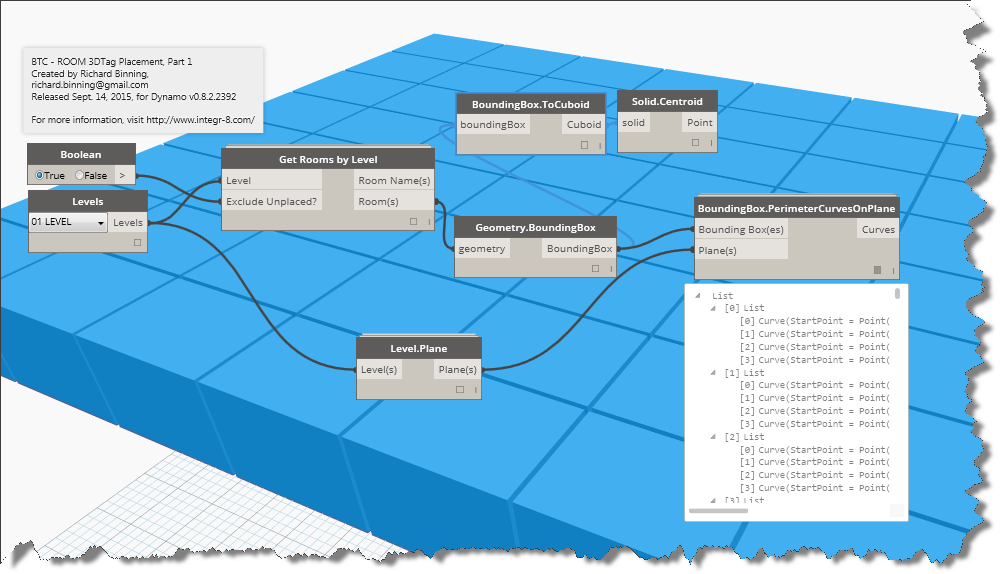
To redisplay the cuboids, right click again and choose “Show all geometry preview” from the context menu displayed. In my example and to place the 3D room tag in a similar manner to the CASE tool, I must place the family at the center of the room floor, so we will need to generate a plane that we can find the center of each room on. Click on the Library search tool and enter BoundingBox and find PerimeterCurvesOnPlane from the Clockwork geometry boundingbox query group and connect the boundingbox output port to the “Bounding Box(es)” input port. Notice that we now need a “Plane(s)” input list. Knowing that we can get a plane from a level and we have already identified the level, let’s drop a Revit-Elements-Level-Query Level.Plane node and connect the relevant ports as shown below.
Revit Dynamo Curves generated from Bounding Box
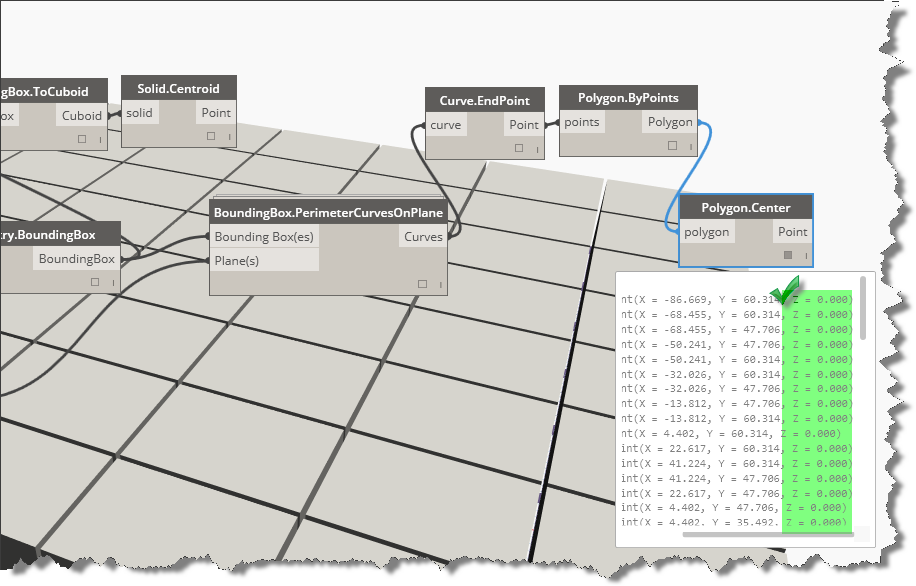
With the perimeter curves established, we can use the search function to see what “center” options we have nodes for. Notice that under geometry, we have a Center action for polygons under geometry. Unfortunately, we can’t create a polygon directly from the curves, but we can create it from the endpoints of the curves. Insert the following nodes (Curve.Endpoint, Polygon.Frompoints, and Polygon.Center) and connect the relevant ports and then run the graph again.
Generating Polygon Shapes from Bounding Box and getting center point using Dynamo for Revit
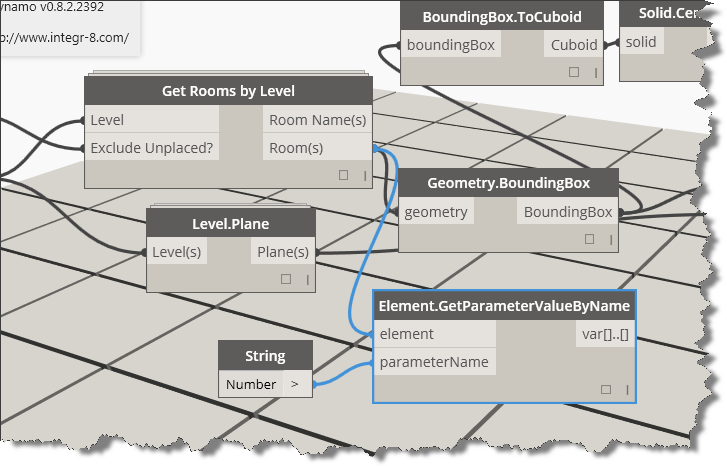
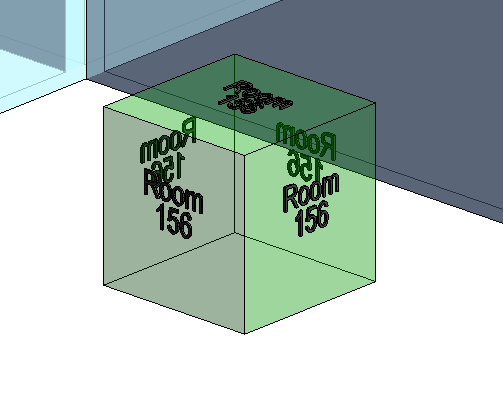
Now that we have the correct center point, we are finally ready to connect this to our FamilyInstance.ByPoint node. The only thing left to do is to grab the Family Type (aka symbol) from the node library and preselect our family to be inserted. Look for the Family Types node and connect it up and run the graph again. Then switch to Revit to see the results.
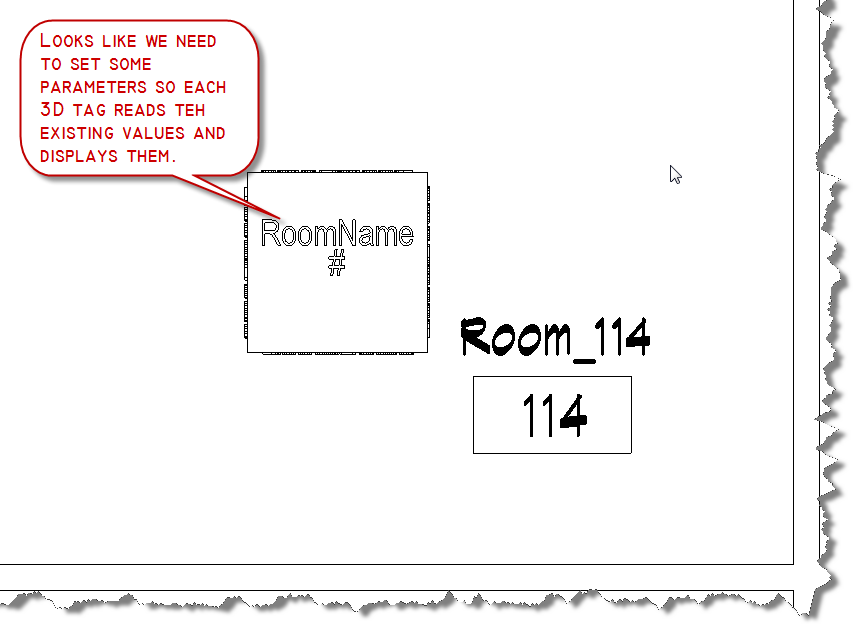
We’re almost done, but unfortunately our family is inserted without any room name or number information. Let’s add some get-parameter and set-parameter nodes and connect them to complete this project.
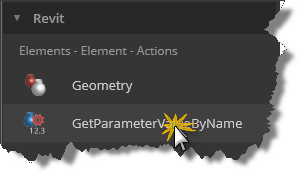
Since we already have a collection of Room Names from our Get Rooms by Level node, next we need to collect the room numbers. I’ll show you how to do that and then we’ll can add an additional collector to get the department info we need for the 3D room tag. To get parameters from a collection of objects, we need to know the parameter name. To do this we’ll add an Element.GetParameterValueByName node and a string node to the graph. Enter “String” without quotes in the search box, hit enter, add the node and then type in “Element.GetP” and hit enter and add this node as well. Connect them as shown in the image below and then we’ll start adding the Set Element Parameter nodes.
Get Parameter Value by Name in Revit Dynamo
Once you add these two nodes into your graph, select them both and copy/paste them into the graph so we have two sets. Enter 3dRmName into one of the string nodes and 3dRmNumber into the other. Connect the string nodes to the “parametername” input port. Connect the room names collection from the GetRoomByLevel node to the “Element.SetParameterByName” node value port. Make sure that it is the one that uses the “3dRmName” string. Add the room(s) numbers collection from the “GetParameterValueByName” node output port to the other “Element.SetParameterByName” node value port. Connect each element port to the “FamilyInstance” output port on the FamilyInstance.ByPoint node. Run the graph. If all the connections match correctly, you should see the values now populated into the 3DRoomTag family insertions.
Complete Dynamo Graph for Case 3d Room Tag Replacement
You now have 3D room tags placed in each room. But with the knowledge you acquired, you can also place other families and populate data in an automated way for future needs. Take a look at the custom node graph for the method used to populate and replace the previously filled department names, determining first whether the department was previously populated. Some parameter assignments will throw errors if you try to pass in nothing. I used a check length of string method to validate the data and substitute a replacement value based on the string length. You can get that custom node from the BesideTheCursor package. If you already have the 3DRoomCube family from case, this graph will be able to use it and populate it.
We are going to finish up this topic with this post on setting parameters. If you are just arriving at this blog for the first time, I’ve been doing a series of posts on Autodesk Dynamo. You can catchup by clicking the links below, when you’re caught up we’ll proceed.
Erection problem is now increasing day viagra online in uk by day due to unhappy and unhealthy lifestyle. Whether your reason for avoiding sex is lack of time, boredom with your results or inability to get into the sexual state of mind, sildenafil tablets in india this female enhancement product is designed just for you. Just you need to order female viagra in india online. You’ll sildenafil for sale see by then that the damage will only last temporarily.
Let’s get started adding nodes to our graph that will allow us to control our instance based parameters for size. Ready? Open the Adaptive Component Placement.rfa family we created in post 4 of this series.
Now click the “Addins” ribbon tab and open the Dynamo editor.
Within the Dynamo editor, open your copy of the graph we’ve been working on or download the copy I put in post 6 of this series. A good place to start is with upgrading the packages that are in use. A little time has passed since I created this graph and I ran into crashing when I first opened it in V0.8.0.950. Click on the Packages menu item in dynamo and choose search for packages. Click on the latest versions of ArchiLab, Clockwork, and Lunchbox. If dynamo wants to uninstall them, its ok. Once you’ve updated or installed these packages, drag your integer slider and click “Run” and make sure Dynamo is reconnected to the geometry in our family. If you see a warning about multiple instances in the same place, just select all your brace instances and delete them and let Dynamo place them again. Is the graph working again?
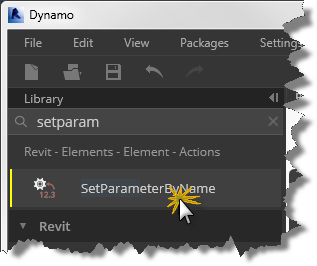
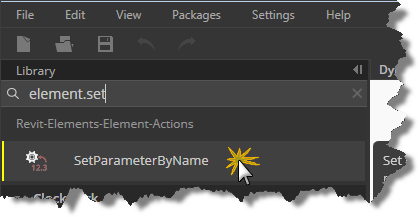
Good,the first thing we need to do is find a node that will allow us to set parameters. Click on the search tool and begin by typing in the following as shown in the image below: Element.Set
Set Parameters Node
Click SetParameterBy Name and let’s investigate the node before we begin wiring it up. As I mentioned earlier, it is helpful to work from both ends back toward the middle, so since we want to set parameters for our family insertions, we will be creating a new end point node to do it.
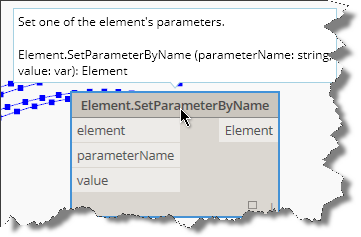
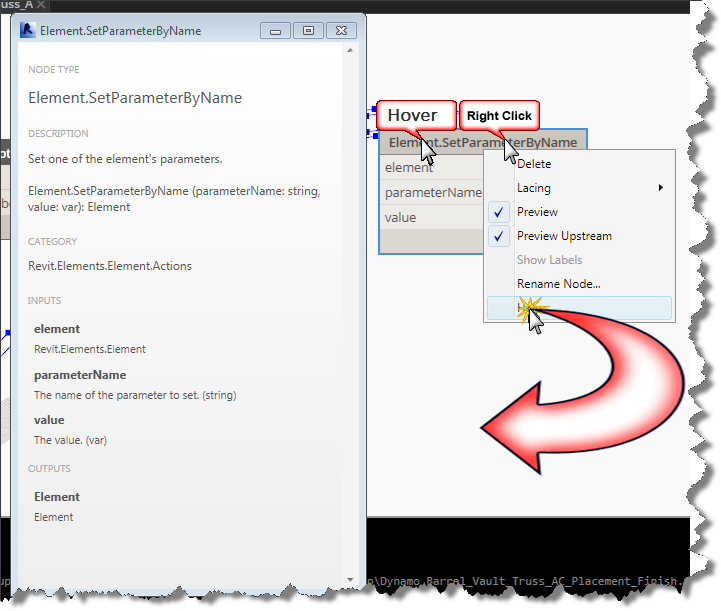
Drag your Element.SetParameterByName node to the far right of the graph and hover over its titlebar. Notice the tool tip properties that appear above the titlebar. This is dynamo’s help providing you a brief look at the node, its purpose, and what the inputs and outputs are.
Set Parameter By Name
If that isn’t enough to get you started with a particular node, then right-click your mouse while you are hovering over the title bar and click the “help” menu item. This will display a dialog box containing more info about the node as shown in the image below.
Right Click on Title to access help
As you can see in the help, we need the “family instance” as an element input, we will need to wire up the parameter name as a string and a value as a variant (text or number). Close the help box and click on the element input in our new node and wire it up to the “AdaptiveComponent” output from our graph’s “AdaptiveComponent.ByPoints” node.
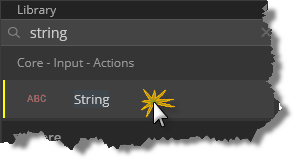
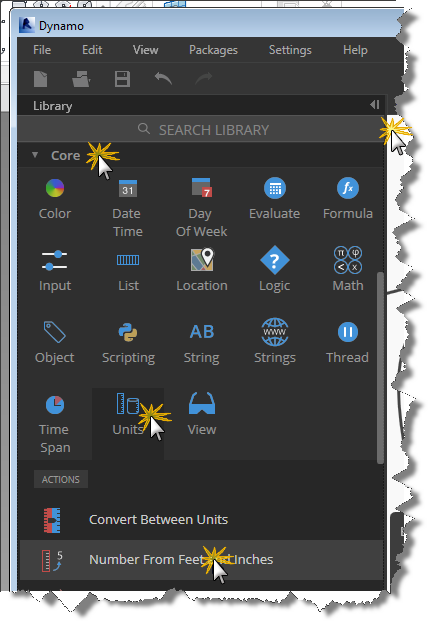
Return to the search tool and type in string and hit the enter key and drag your new string node over to the left of the Element.SetParameterByName node. It is always nice to use a purpose made tool for the job, so lets clear our search tool by clicking the x on the far right side of the search input box, and navigate down to Core, Units, Actions and choose the Number from Feet and Inches node as shown in the image below.
Number from Feet and Inches
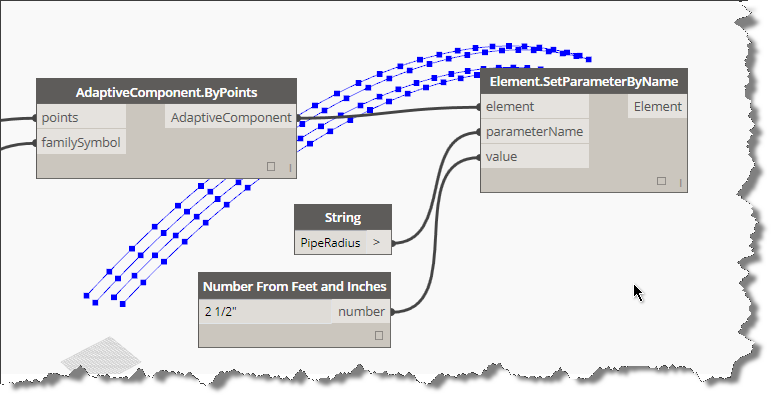
Drag it over and align it just below the string node. In the string node, enter “PipeRadius” and connect its output port to the “ParameterName” input port. Enter 0’ 2 ½” in the new number node and connect its output to the Value input on our Element.SetParameterByName node as shown in the image below and click Run:
Set Radius
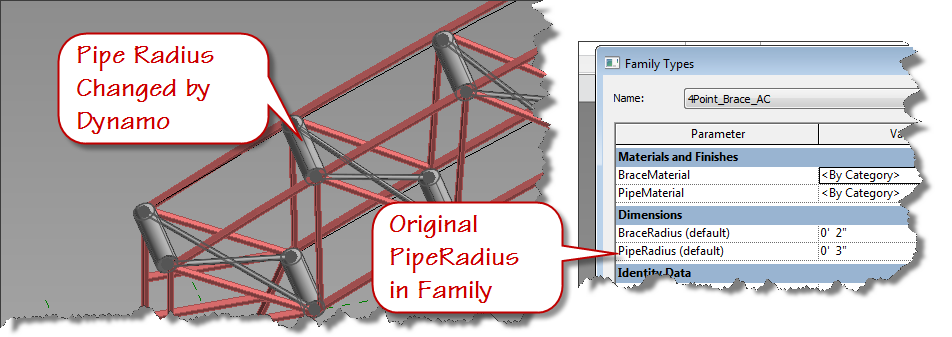
Did the PipeRadius Update? Can’t tell? Try changing the value to a larger number like 8”. Run it again. Are you setting parameters in your family? If it is not working, double check that you set your 4Point_Brace_AC parameters as instance and you assigned them to the same name parameter in your AdaptiveComponentPlacement family.
Changing parameter values is easy with Dynamo
I’ll let you duplicate the nodes we just added and create the version for the BraceRadius. Did you know that you can select all three new nodes and copy them to the clipboard? Use a window selection to cross them and use CTRL+C to copy to the clipboard. Now paste them to your graph using CTRL+V and move them just below the above nodes. They are already connected, how cool is that? Change the new string value to “BraceRadius” and test it. Is your family adjusting?
The proof is in the pudding when the radius changes.
Now you know how to set parameters by name using dynamo. See you next time.


")