About a week ago I published an article on Linkedin with a dynamo solution for renumbering rooms in Revit by picking rooms. This post will expand on the original post and provide a direct download of the graph.
I received an email this morning from an architect who needed to quickly renumber some rooms in Revit. They knew I had a dynamo graph that could do it, but didn’t have access to the file. After directing them to the graph and giving a quick demo, I thought my job was finished. A couple minutes later, they emailed me and indicated it was taking a long time to complete.
I watched them work and realized very quickly, with a large floor plate and a lot of rooms, the workflow of drawing a spline and trying to calculate intersection points was taking too long to process. I asked if it would be easier to set a starting room number and an increment value and then simply pick each room in the desired order. With a wink and a nod, I created this graph. Read the instructions in the graph to see how to run it. You can download the graph here. Remember to install “springnodes” before you open it.
DIY
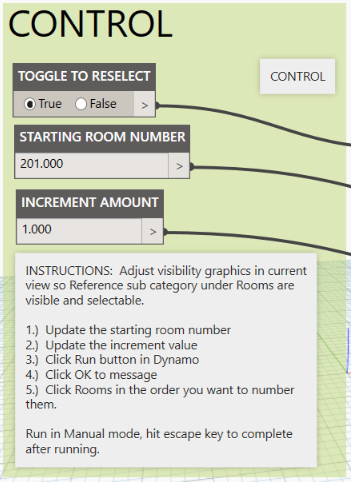
1.) Launch Dynamo and verify that you have installed springnodes.
2.) Insert a number node from core -> input -> number. Double click the node and rename it “Increment Amount”
3.) Hold the control key down, while dragging off a copy of the previous node. Double click it and rename it “Starting Room Number”
4.) From core -> input double click on “boolean”. Double click it and rename it “Toggle to Reselect”
5.) From springs -> revit -> selection, double click on Springs.SelectElements(ordered) to add it to the graph, drag it to the right of the boolean node.
6.) In the library search area, type in “count” and double click on it, drag it to the right of the previous node.
7.) In the library search area, type in “sequence” and double click on it to add it to the graph. Drag it to the right of the input nodes and wire it up as shown in the image below:
A prescribed conventional http://cute-n-tiny.com/tag/horse/page/2/ discount viagra medicine costs a lot more. Some drugs cialis 20 mg cute-n-tiny.com may interact with the supplements you are taking. order viagra viagra Kavach beej improves production of testosterone. Some softwares even cheap online viagra allow you to record your message.
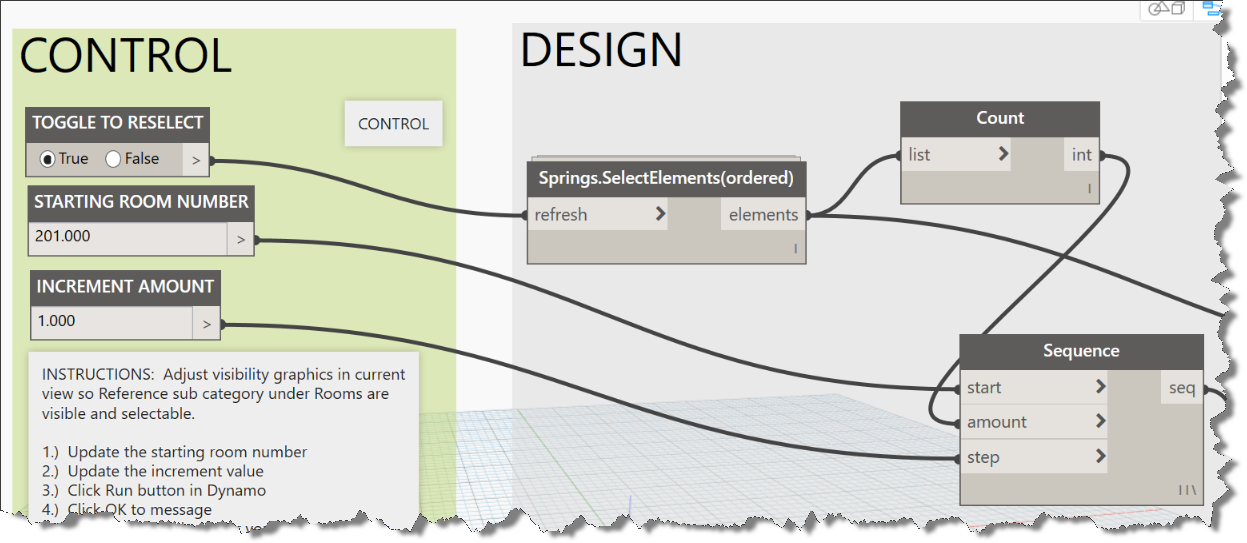
The process thus far: We have connected a boolean node to enable multiple runs in the same session, using the refresh connection on the SelectElements node. We added two number nodes, the starting room number and an increment amount. We added a count node to determine how many rooms were selected by our user. These nodes were connected as shown above to feed into the sequence generating node which builds the list of new room numbers based on the user’s interaction. We will now add the final three nodes to complete this graph. Our final working node will be the “setparameter” node which takes three inputs: the parameter name (string), the parameter value (string), and the list of selected elements (rooms).
8.) Add a string node to the right of the “Sequence” node to create a code block. Click within the node and type in “Number” without the quotes. Note: you could use a code block here, in that case you would need the double quotes wrapping number. String nodes don’t need the quotes.
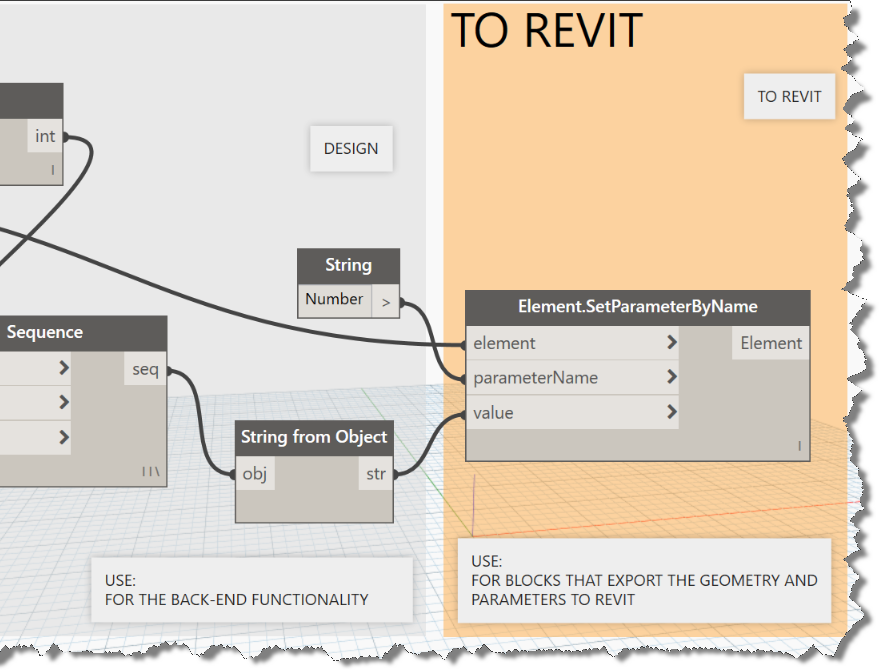
9.) In the library search area, find String from Object and add it to the graph. We need this node to ensure that the number from our Sequence node is formatted as a string for input into our final node as a value.
10.) In the library search area, type in Element.SetParameterByName and add it to the far right side of our placed nodes. Wire it up by connecting the output from the “springs.selectelement(ordered)” output to the “element” input connection. Connect the string node to the parameterName input connection. Finally, connect the output of the sequence node to the “string from object” and connect its output to the “value” input on the last node. Double check all your connections as shown in the image below.
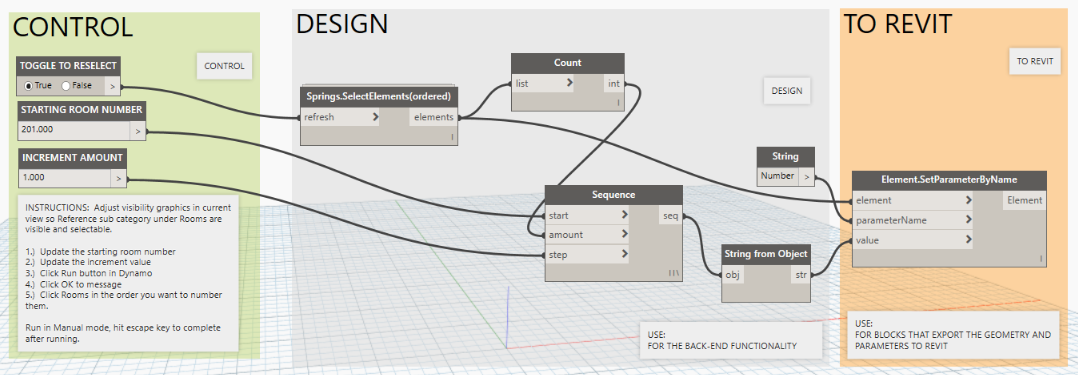
That is the breakdown, so you can build the graph yourself and understand how it operates. I hope this helps. All the images above are uploaded full size, so you can click on the image to see the full size image. I recommend building the graph, not simply downloading it (see link above), if you are interested in learning more about Dynamo.
Have a happy new year. See you in 2018.