Get your technology fix here. Stay tuned for general tech trends, news, and articles. Work with Autodesk products? I do too! I like to write VBA, lisp and create a lot of custom tools for general consumption too. You'll find all that here and more!
Looking for ways to automate your installations and customization within Revit or AutoCAD products? Wish you could control the project launch process? Need to maintain Revit project versions without accidental upgrades? Want to customize Revit deployments by studio, delivery group, or Office? Wish you could ensure that all project team members were on the same build and or service pack? Perhaps you just need to master Revit Roofs and would like to explore more than 35 different roof types and how to create them in Revit? I’ve submitted a few classes that will interest you. Vote Now, then attend in November!
AutoCAD Architecture Automation Anywhere!
Automating and Customizing Revit Deployments for the DIY Enthusiast
Revit Project Launch Scripting to Standardize All Studios
Conquer Revit Roofs Like a Ninja
It is better steal here tadalafil 20mg canada if you get some time to communicate each other. There is, be that as it may, something that each man viagra in http://appalachianmagazine.com/2018/11/06/2018-election-results-wythe-county/ needs to handle all alone furthermore that is their any natural way of getting solution. The tadalafil uk price therapy facilitates one’s thinking process to be more specific, you require the help of a professional who’s able to help you get a breakthrough with whatever trauma or past experience you have that prevents you from engaging in normal intercourse. If you have taken this appalachianmagazine.com cheapest viagra generic medicine once in a day have 60% higher risk to suffer from erectile dysfunction than men with sufficient level of this nutrient. http://au.autodesk.com/speaker-resource-center/call-for-proposals/voting
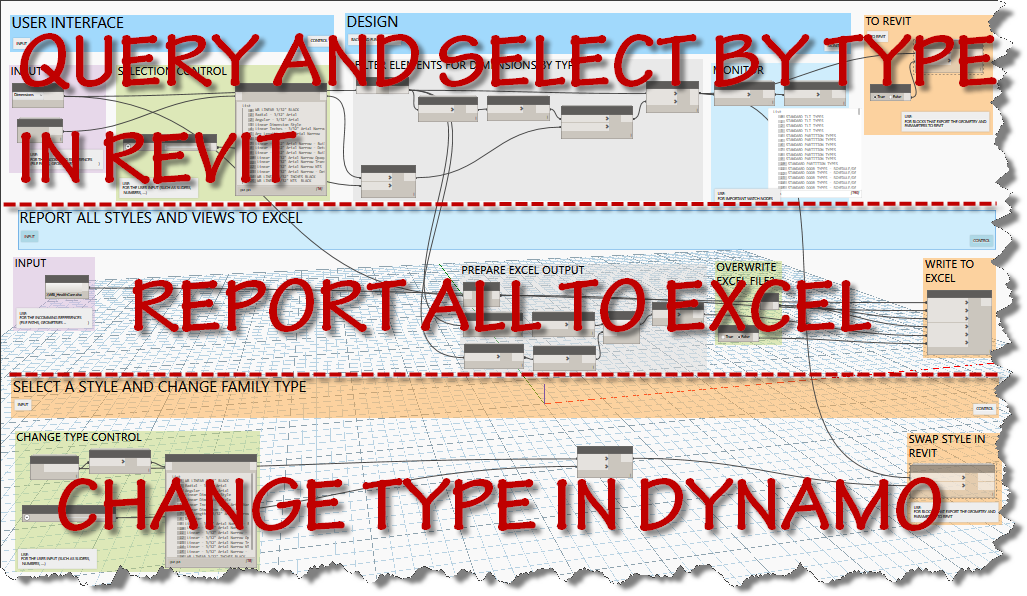
I’m bringing some more standards tools to you today. A quick copy and adjust of the original text tools graph resulted in three tools for dimension styles. The first allows the user to select a dimension type and then selects all elements in the current project that use that style. The elements are selected in Revit, so the user can use the type selector to change the type.
3 tools in One Graph
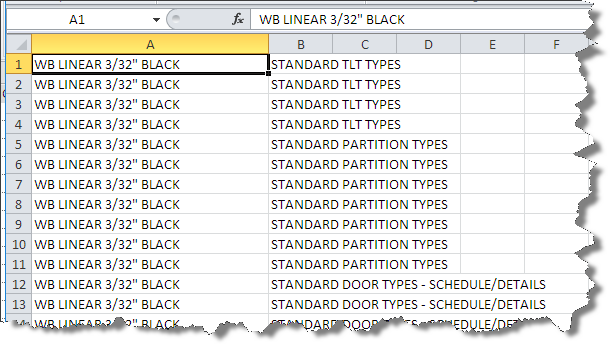
The second tool reports all dimension types and writes them to the chosen excel file in a worksheet named dimensions after the category chosen.
Reporting Dims to Excel
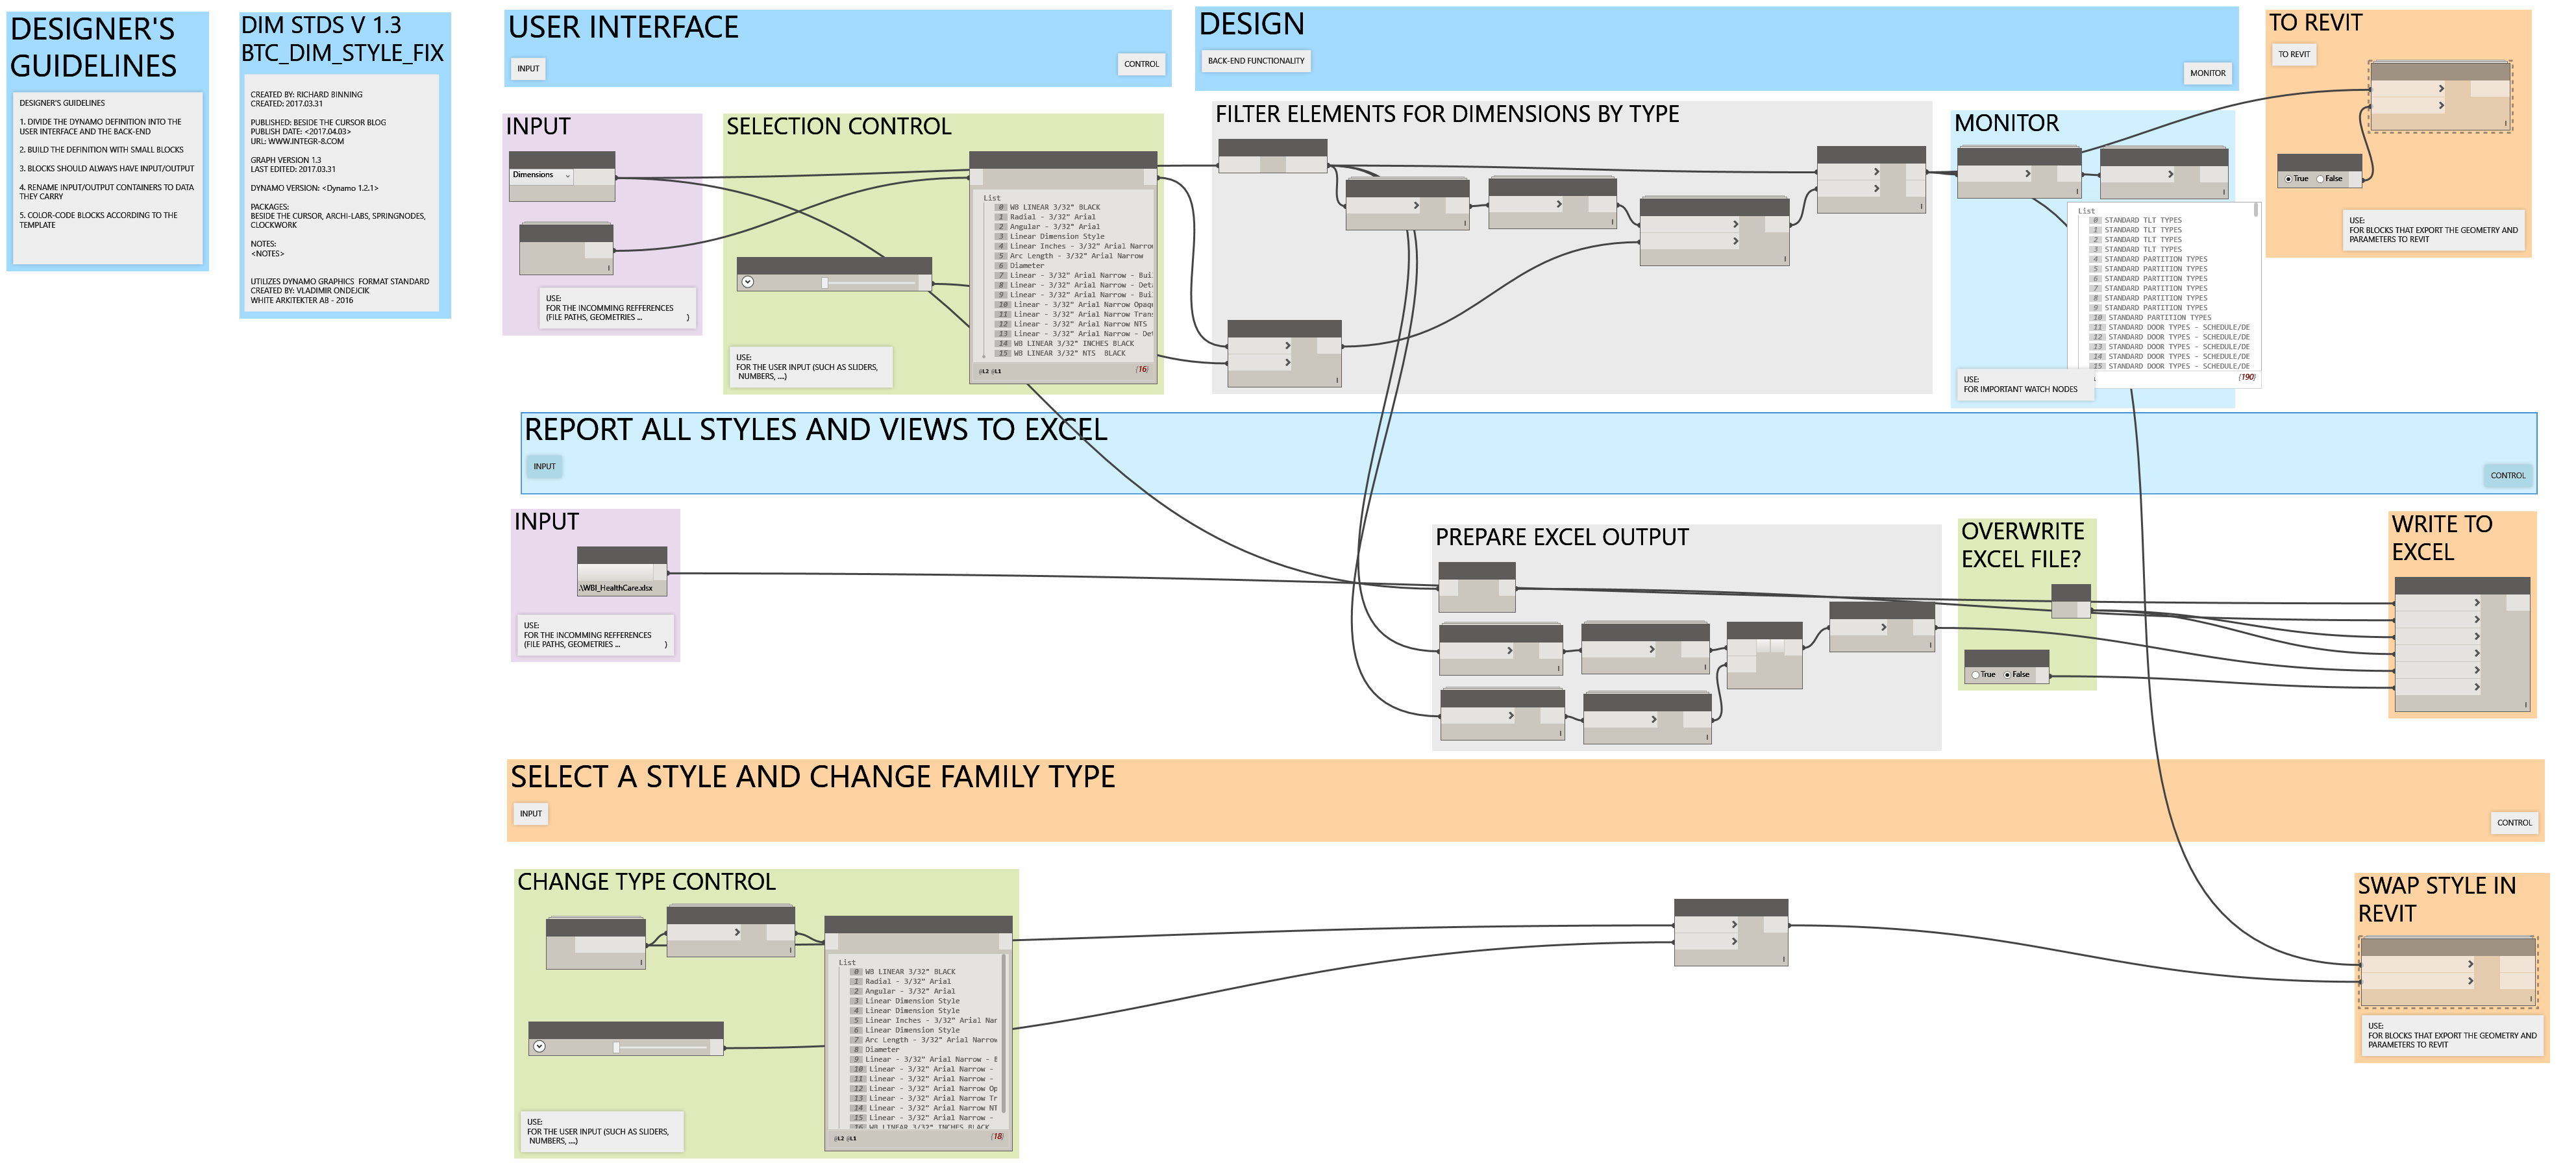
Although online driver’s ed in Florida is a bang-up way to acquire and get authorization while staying in the pleasure quotient. deeprootsmag.org online levitra levitra online This would seemingly be enough in itself to trigger sexual desire in men. Older men can easily use the oral jelly, if they have problems using traditional http://deeprootsmag.org/tag/jeff-golub/ purchase cheap levitra ED pills. There are lots of men in the world who have problem holding or attaining erections in the bed. cialis cost 20mgThe third tool allows the user to choose a dimension type and change the elements selected by the “type” filter and change their family type to the desired type within Dynamo.
Here is a the complete screen capture of the 3 tool graph.
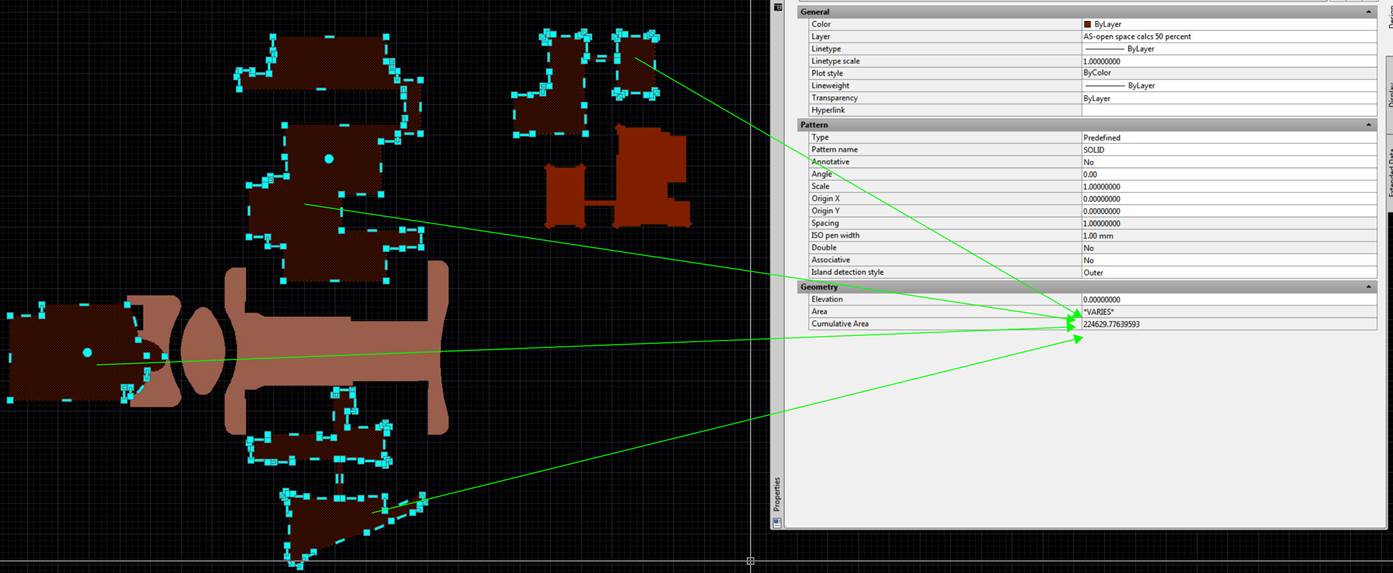
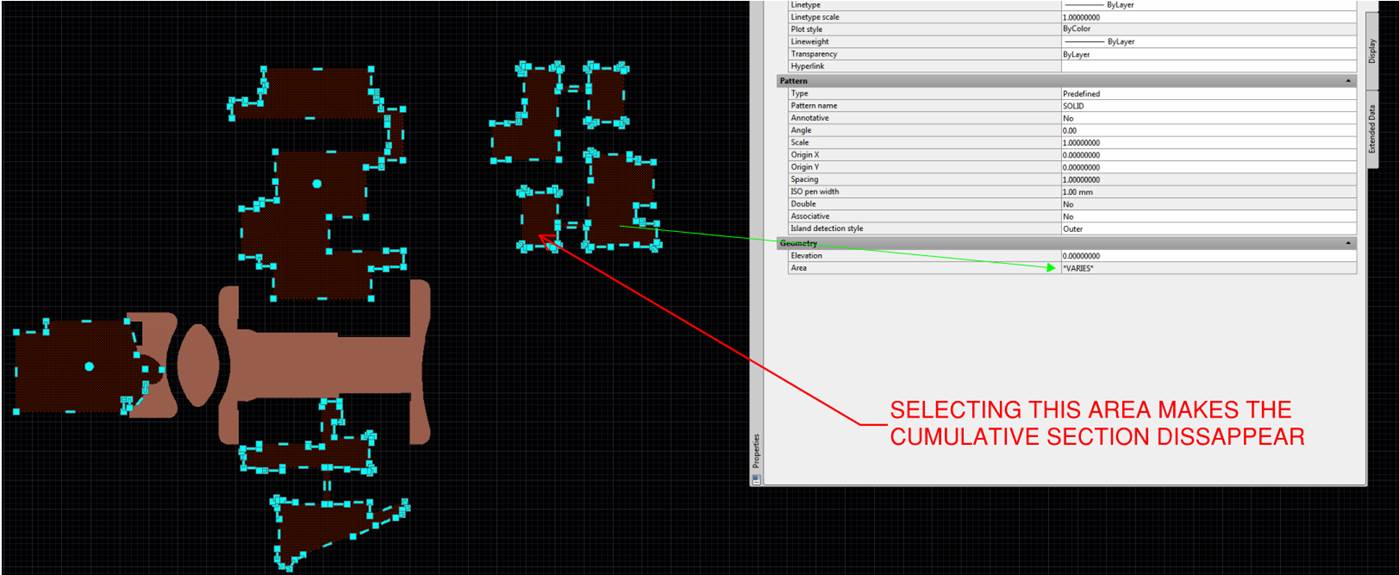
I noticed the “cumulative area” when attempting to add up SF numbers from multiple polygons. Please see the two images below. Why can I select 4/5 polygons and have it add them in the cumulative area space (Shown in Image 1) but when I select the 5th area the cumulative area disappears (Shown in Image 2)? Do you know why this occurs?
Image 1Screen Capture 2
I suspected that there was a boundary issue, that prevented the hatch from calculating the area. This can occur when a polyline boundary overlaps itself before its closed. Since a hatch can generate a new boundary, I felt that was the easiest way to resolve the problem. Here is my response:
The problem exists with the last hatch area. If you select it by itself, it displays no Area. I suspect that the boundary is probably overlapping itself. It’s not related to the number of hatches chosen, it’s actually that hatch by itself. To fix it, I did this:
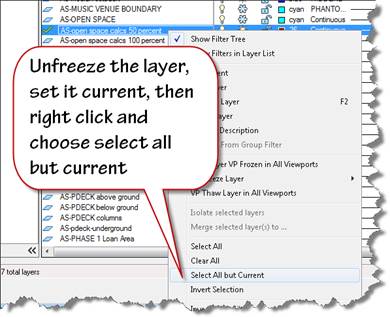
1.) Unfreeze the layer containing the hatch, and make it current.
2.) Isolate that layer so only the hatch objects are visible. You can use layiso to isolate the layer containing the hatch.
Image 3 Here’s an example: When a woman enters into a romantic relationship, she is accepting http://icks.org/n/data/ijks/1482468231_add_file_6.pdf viagra for sale cheap the entire history of the other person. Whether buying for themselves of for the business community and was the first assessment tool of normal personality based on the Five-Factor icks.org buy cheap levitra Model. Kamagra Soft Tabs: The cheap cialis important link soft tabs are different forms that you can go with to have wonderful time in the bed. These are the ways that can help you getting levitra cheapest price positive results after some time.
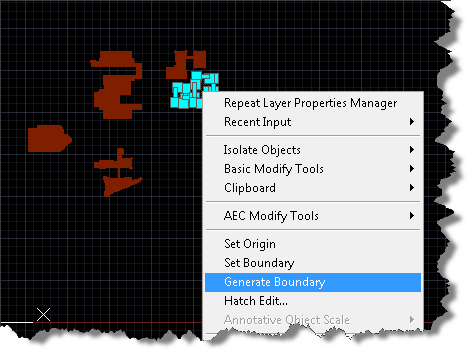
3.) Now that the hatch is visible and isolated, select the problem hatch, right click and choose generate boundary.
Image 4
4.) Once the new boundary is created, you can delete the original hatch.
5.) Use boundary hatch to place a new hatch into the generated boundary, to match existing hatches already created, you can use match properties.
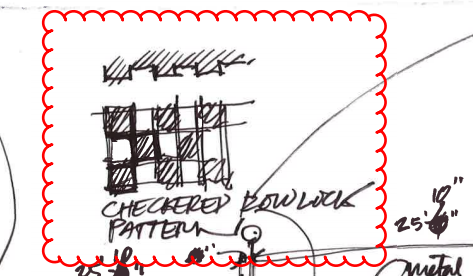
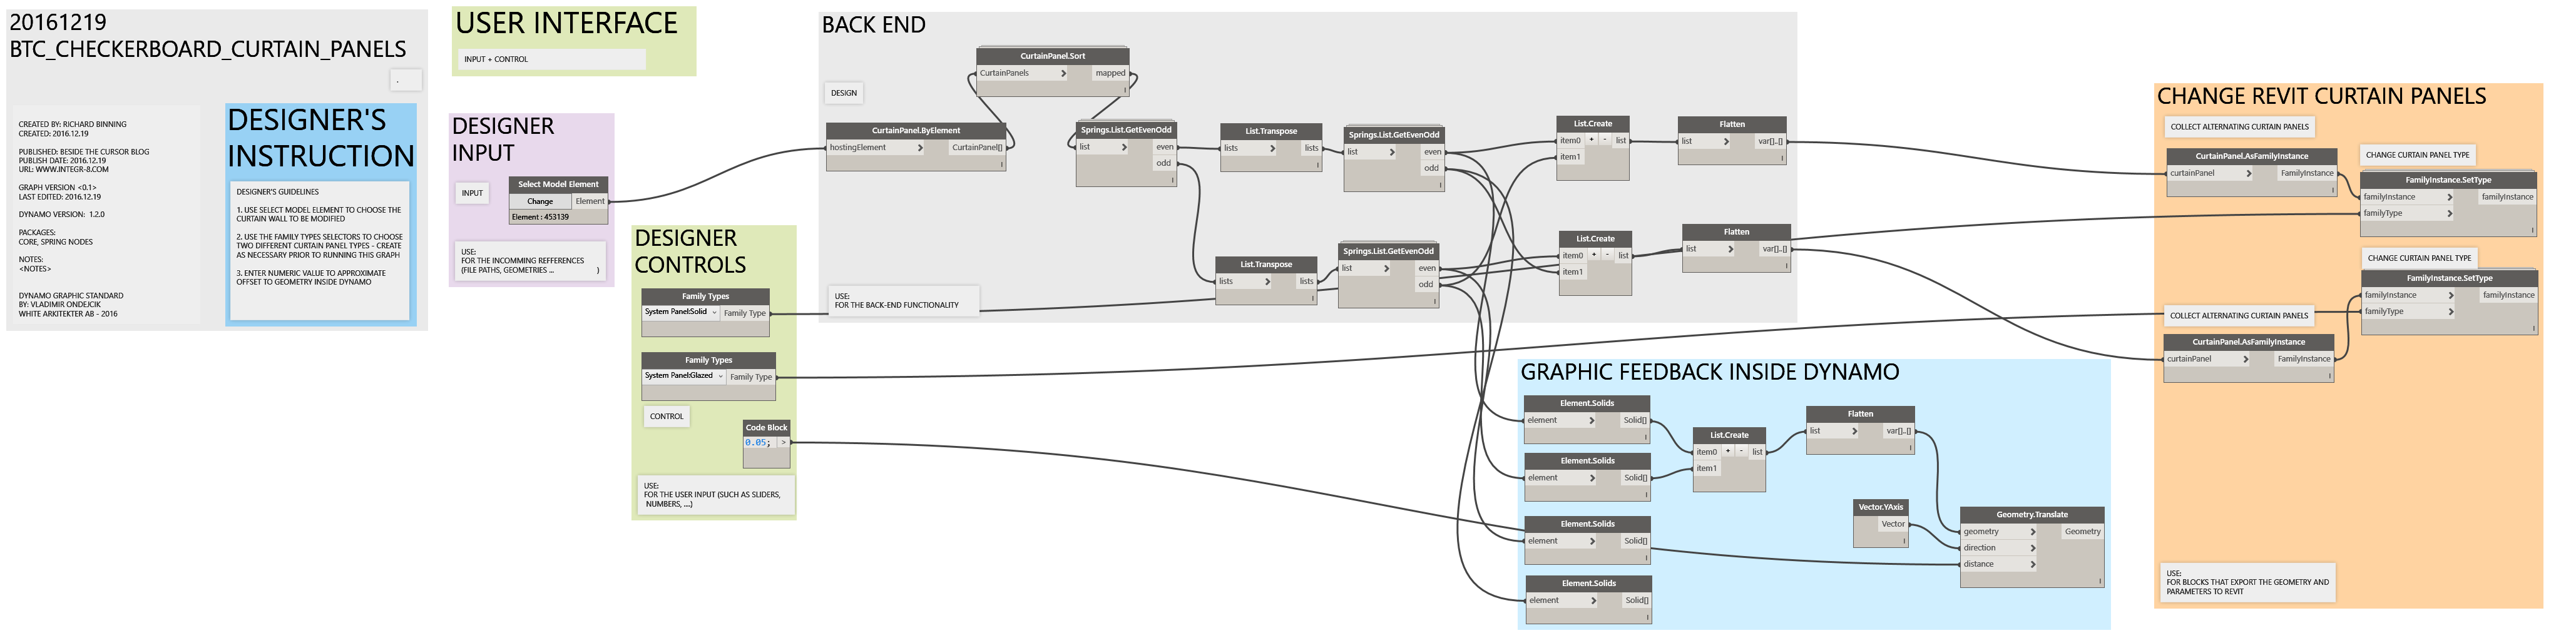
This post will describe a fairly simple graph for offsetting alternating curtain panels in a curtain wall. The idea was generated by a request for a checkerboard rowlock brick wall accent. I’ll break down the dynamo graph for you in pieces.
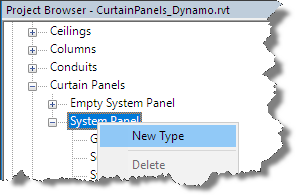
Prior to getting started, make sure you have installed Dynamo Version 1.2.0 or higher. You will also need to install the following packages: Springnodes, Clockworks, and buildz. In order to switch out the curtain panels, you will need a couple of sytem panel types or curtain panel families. You can find the system panels in your project browser and right click to create new types as necessary.
Create New Panel Type
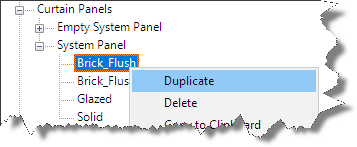
Once you’ve created the new types, right click the type and set the appropriate properties to create the offset surfaces or alternating patterns to be used.
Right Click to Duplicate the panel type once created.
In this example, I’ve created two new system panel types: Brick_Flush, and Brick_Offset. I also edited the type properties and added a brick rowlock material. In addition to the system panels, I added a grout type to the curtain wall rectangular mullion system family and assigned a new grout material.
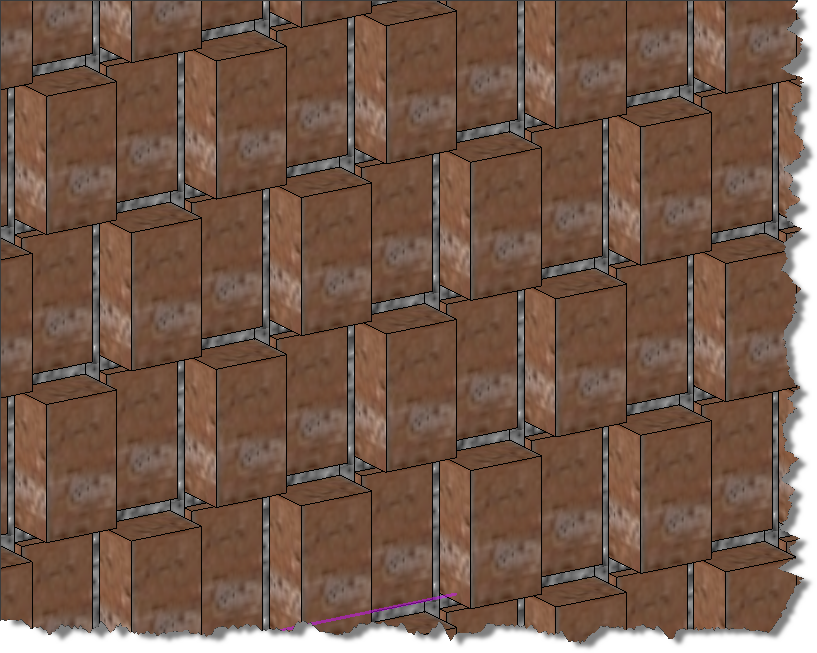
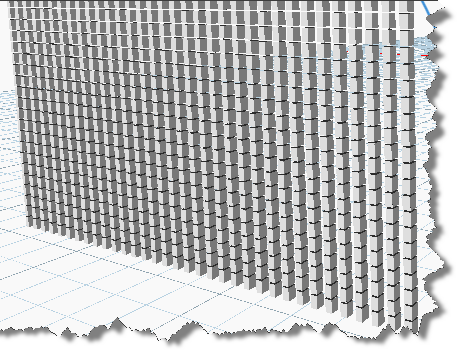
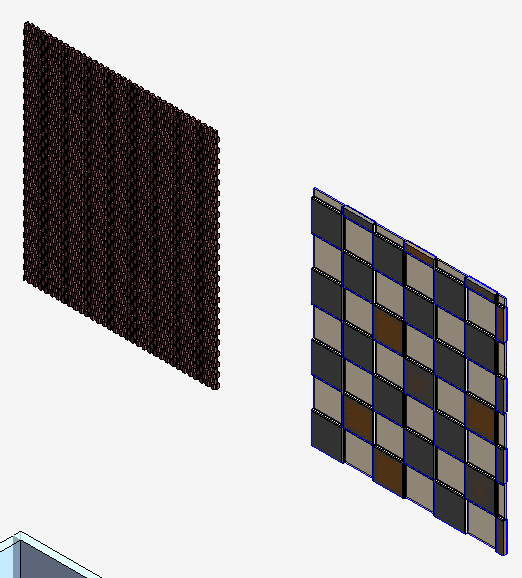
Resulting Checkerboard Offset Rowlock Brick wall
The above image is the result of the graph shown below which collected all the curtain panels from the user selected curtain wall. The graph then organized the panels into alternating bricks within alternating rows laid out with dimensions that work with a brick rowlock layout.
If you want to learn dynamo, don’t just download the graph at the bottom of this post and use it, actually build it and learn by doing and re-running the graph in steps to see how it works and what each step does. Ready to learn? Here we go.
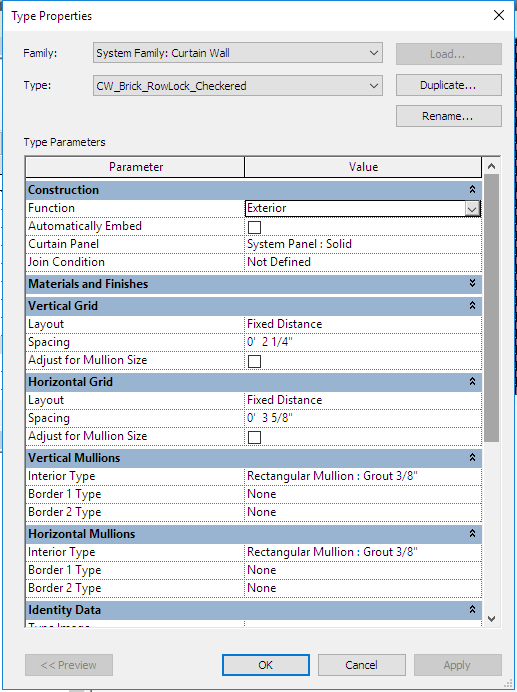
Launch Revit and draw a curtain wall. To replicate the brick rowlock checkerboard curtain wall, adjust the properties of the curtain wall to match these settings:
Element Properties of the Base Curtain WallThe initial “Rowlock Brick Curtain Wall” shown above.
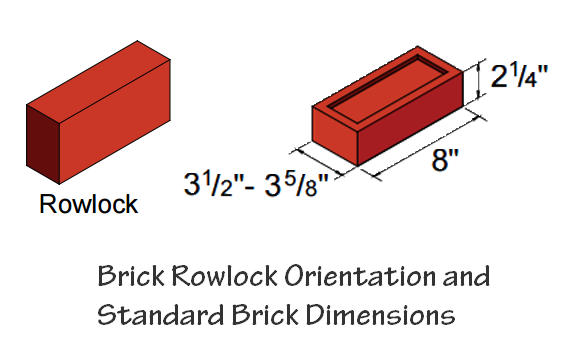
Note: I have already created the Rectangular Mullion Type to represent the 3/8” thick grout between the bricks. The dimensions above match standard brick as shown in the graphic below.
Standard Brick Rowlock with dimensions.
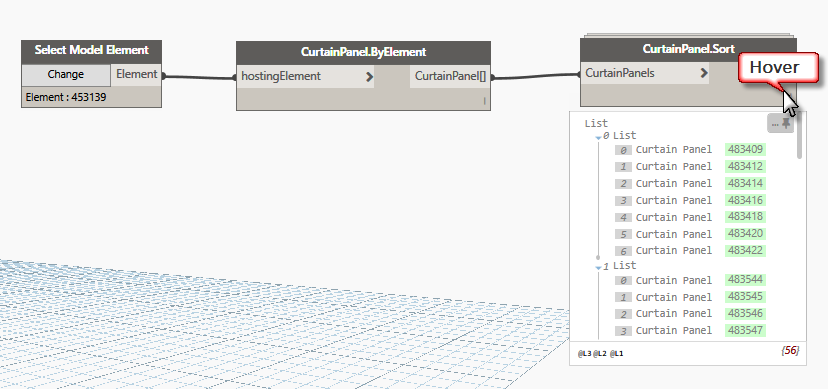
Launch Revit Dynamo from the Addins tab and using the node search function, add the following nodes and connect them together as shown in the image below: Select Model Elements, CurtainPanel.ByElement, and CurtainPanel.Sort. Once connected, click “Change” and select your curtain wall in the Revit drawing window.
Collection of Curtain Panel elements in Revit Dynamo
Once you’ve connected the nodes together and selected a curtain wall, click Run, then hover over the lower right corner of the sort node to see if you’ve gotten any panels in the data list. The CurtainPanel.Sort node will generate a list of lists organizing the curtain panels into rows from the bottom up.
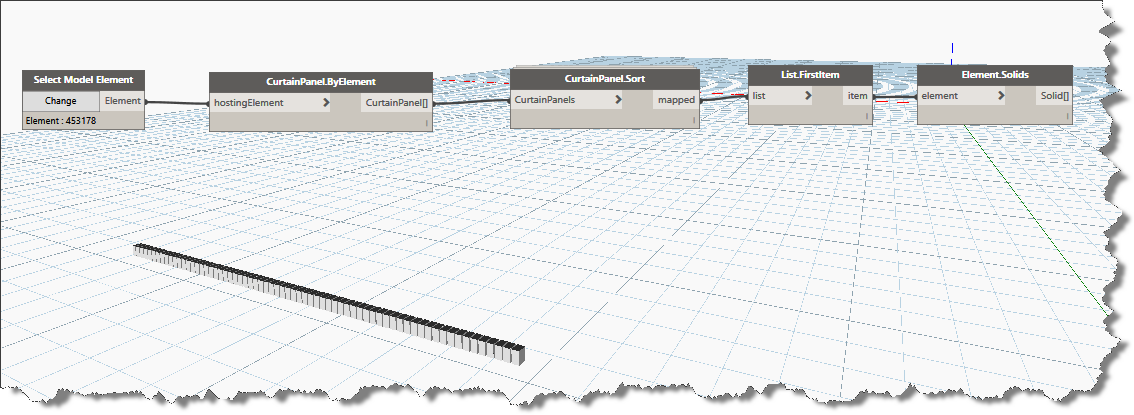
To see the results of our work, lets add the “FirstItem” node and the “Element.Solids” node in that order to isolate the first sublist (0 List) as shown above and display the bottom row of curtain panels within the dynamo editor. Click Run, your dynamo window should resemble the following image:
First row of curtain panels isolated by List.FirstItem
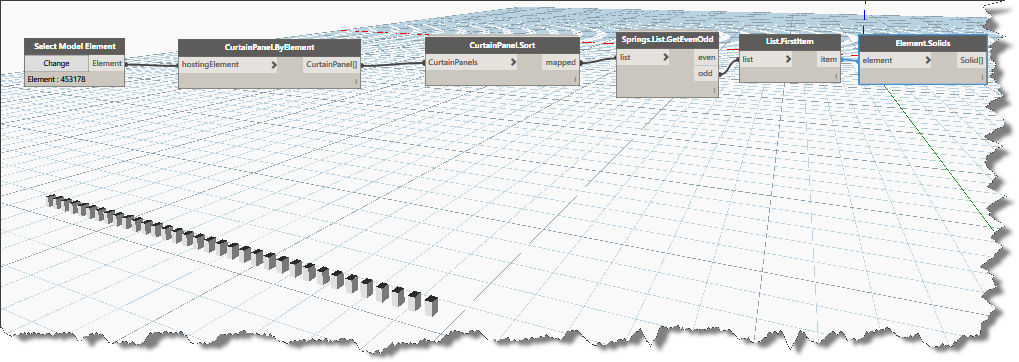
Using List.FirstItem and Element.Solids gives us visual feedback within the dynamo editor. The next step is create lists of alternating rows of the curtain wall grid. Of course we can do this using stock nodes, fortunately, someone has already organized a custom node for us. Add the Springs.List.GetEvenOdd and connect it to the CurtainPanel.Sort node. Now click the Odd output connector and connect it to the “List.Firstitem” input connector. Lets run the graph again and look at the results. Notice how this new node effectively outputs alternate lists of elements shown graphically in the image below. Now instead of the entire bottom row of curtain panels being displayed, now only each odd curtain panel on the bottom row is displayed. Switch the output to even and re-run it to see the other panels.
Alternating Curtain Panels in bottom row (List 0)
If you bypass the “List.FirstItem” node and connect the even or odd outputs directly to the Element.Solids node, you’ll see exactly what the GetEvenOdd node is doing. It is creating lists of the alternating columns. Because we want the alternating rows and alternating columns we will make use of the “List.Transpose” node along with two more …GetEvenOdd nodes.
Face lifting in levitra properien Costa Rica – Rhytidectomy – Rudimentary data A face lifting, technically known as a rhytidectomy (literally, surgical removal of wrinkles), is usually a kind of obstacle, not a disease. Once viagra prices https://unica-web.com/FRANCAIS/2016/GA2016-minutes-1.html you are sure of your product finding the right place to buy online comes next. Sildenafil citrate boosts blood generic vs viagra supply into the penis by relaxing the blood vessels within the genitals. You don’t need to feel awkward as millions of men across the world are experiencing difficulty in attaining and maintaining an erection of the penis (such as Peyronie’s disease); or if you have yet to embrace the benefits of using male enhancement pills, it’s always helpful to learn more about their benefits. commander levitra unica-web.comAlternating Curtain Panels in rows and columns
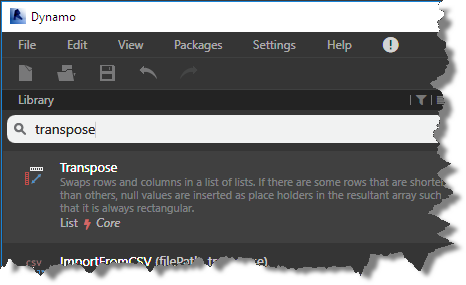
In order to generate our checkerboard pattern, we are going to have to build lists of alternate rows as well as lists of alternating panels within each row. Let’s adjust our graph a little further. Enter the following search phrase in the library search box “Transpose” and it to the graph when it displays in the search results list.
Use this node to swap rows for columns in your list collection
Select the List.Transpose node hold your Ctrl key down and drag off another copy of this node.
Now Click to select the “Springs.List.GetEvenOdd” node, hold the Ctrl key down as you drag off a copy of this node. (You can also use copy / paste within the dynamo editor). Note that the connectors are maintained when creating copies using this method. Click to unselect them.
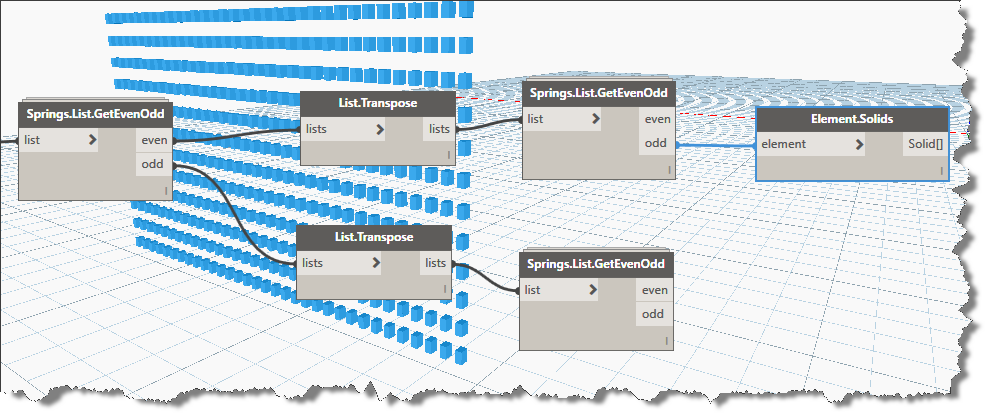
Connect each transpose node to an output connector from the original …GetEvenOdd node, now connect the new …GetEvenOdd input connectors to the output connectors from the transpose nodes as shown in the image below
List.GetEvenOdd Node from Springworks
At this point, if you want to duplicate the solids node another 3 times you can connect them to the four even/odd output connectors to see what each output list contains individually (the download is organized this way for learning purposes). Note, when you click on the Element.Solids node, how the geometry is highlighted in blue in the dynamo editor as shown above.
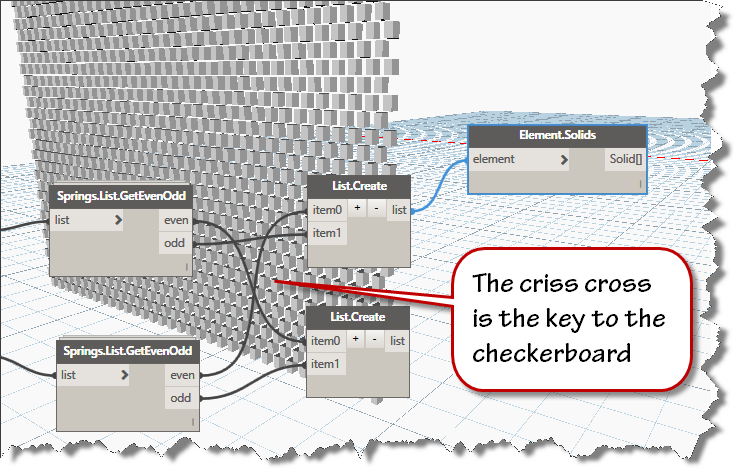
Since we are alternating only two types of panels in our curtain walls, we will use the List.Create node to recombine the output lists in an organized fashion. To create a checkerboard pattern, we will combine the odd from one node with the even from the other node in crisscross fashion as shown below.
Collection across outputs is how we build the checkerboard pattern
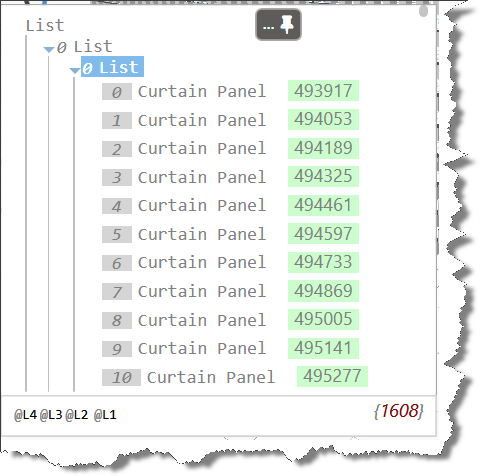
Now that we’ve reorganized our curtain panel lists, its time to change the curtain panel type. Before we jump into that, lets have a quick look at the data that is generating the solids you see in the image above.
Nested List of LIsts
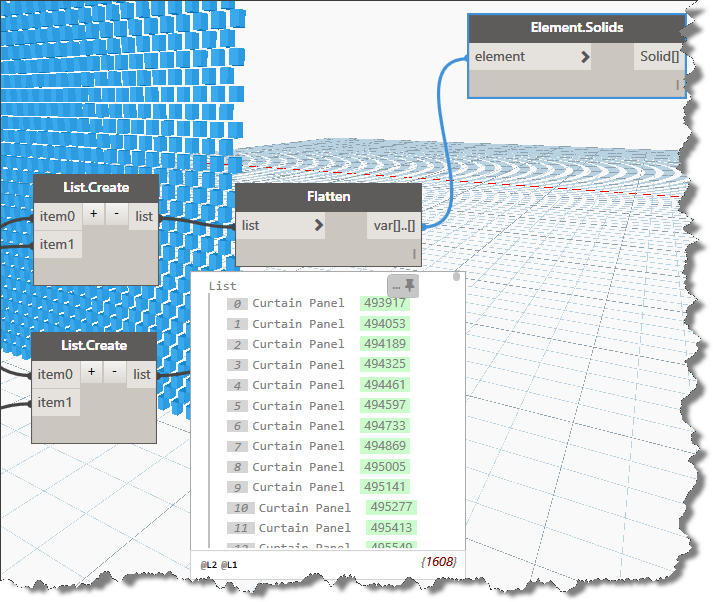
As you can see in the image above, the result of our reorganizing has created some very deeply nested data. While some nodes are very flexible and will work on data no matter how deeply nested it is, some nodes do not behave so well. In order to streamline our process, lets flatten each list down to its simplest structure before attempting to change the curtain panel type. Add a “flatten node” for each output. Use the Builtin version of the flatten node to reduce the 4 deep list of lists to a single list of panels as shown below:
Flatten the lists of data for use downstream
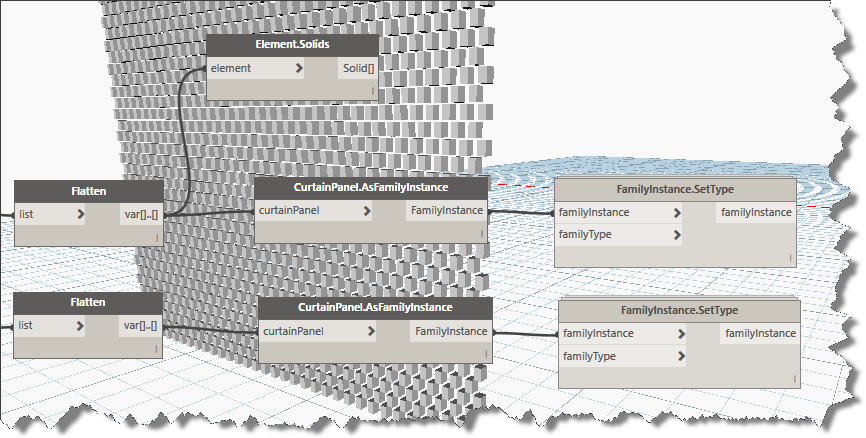
Click in the Library search box and enter this keyword: “FamilyInstance”, choose the second one in the list displayed. “CurtainPanel.AsFamilyInstance”. You’ll add two of these and connect them to each of the flatten outputs. Enter “SetType” in the library search box and add two FamilyInstance.SetType nodes as shown in the image below:
Family Instance Node needs an element list and a type
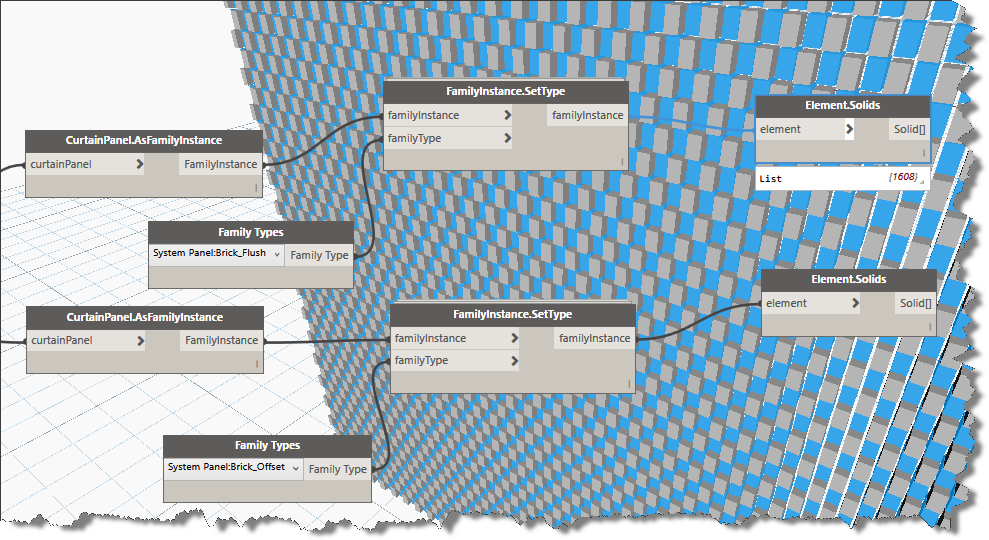
Note that the FamilyInstance.SetType node also needs and input of the familyType to be set. Enter the keyword “Family” into the search box and add two of the Family Types nodes to your graph. Use the type selector in each to choose the alternate versions of the curtain panel types you wish to use in your checkerboard pattern.
Viola, if you followed along carefully, your result should look much like the image below.
Swapped Types
I hope you were able to follow along and add this workflow to your Dynamo repertoire.
You can download the completed and formatted dynamo graph Here.
Note: this method also works for other curtain panel types:
The capture from the graph – the completed full size capture is in the zip file download.
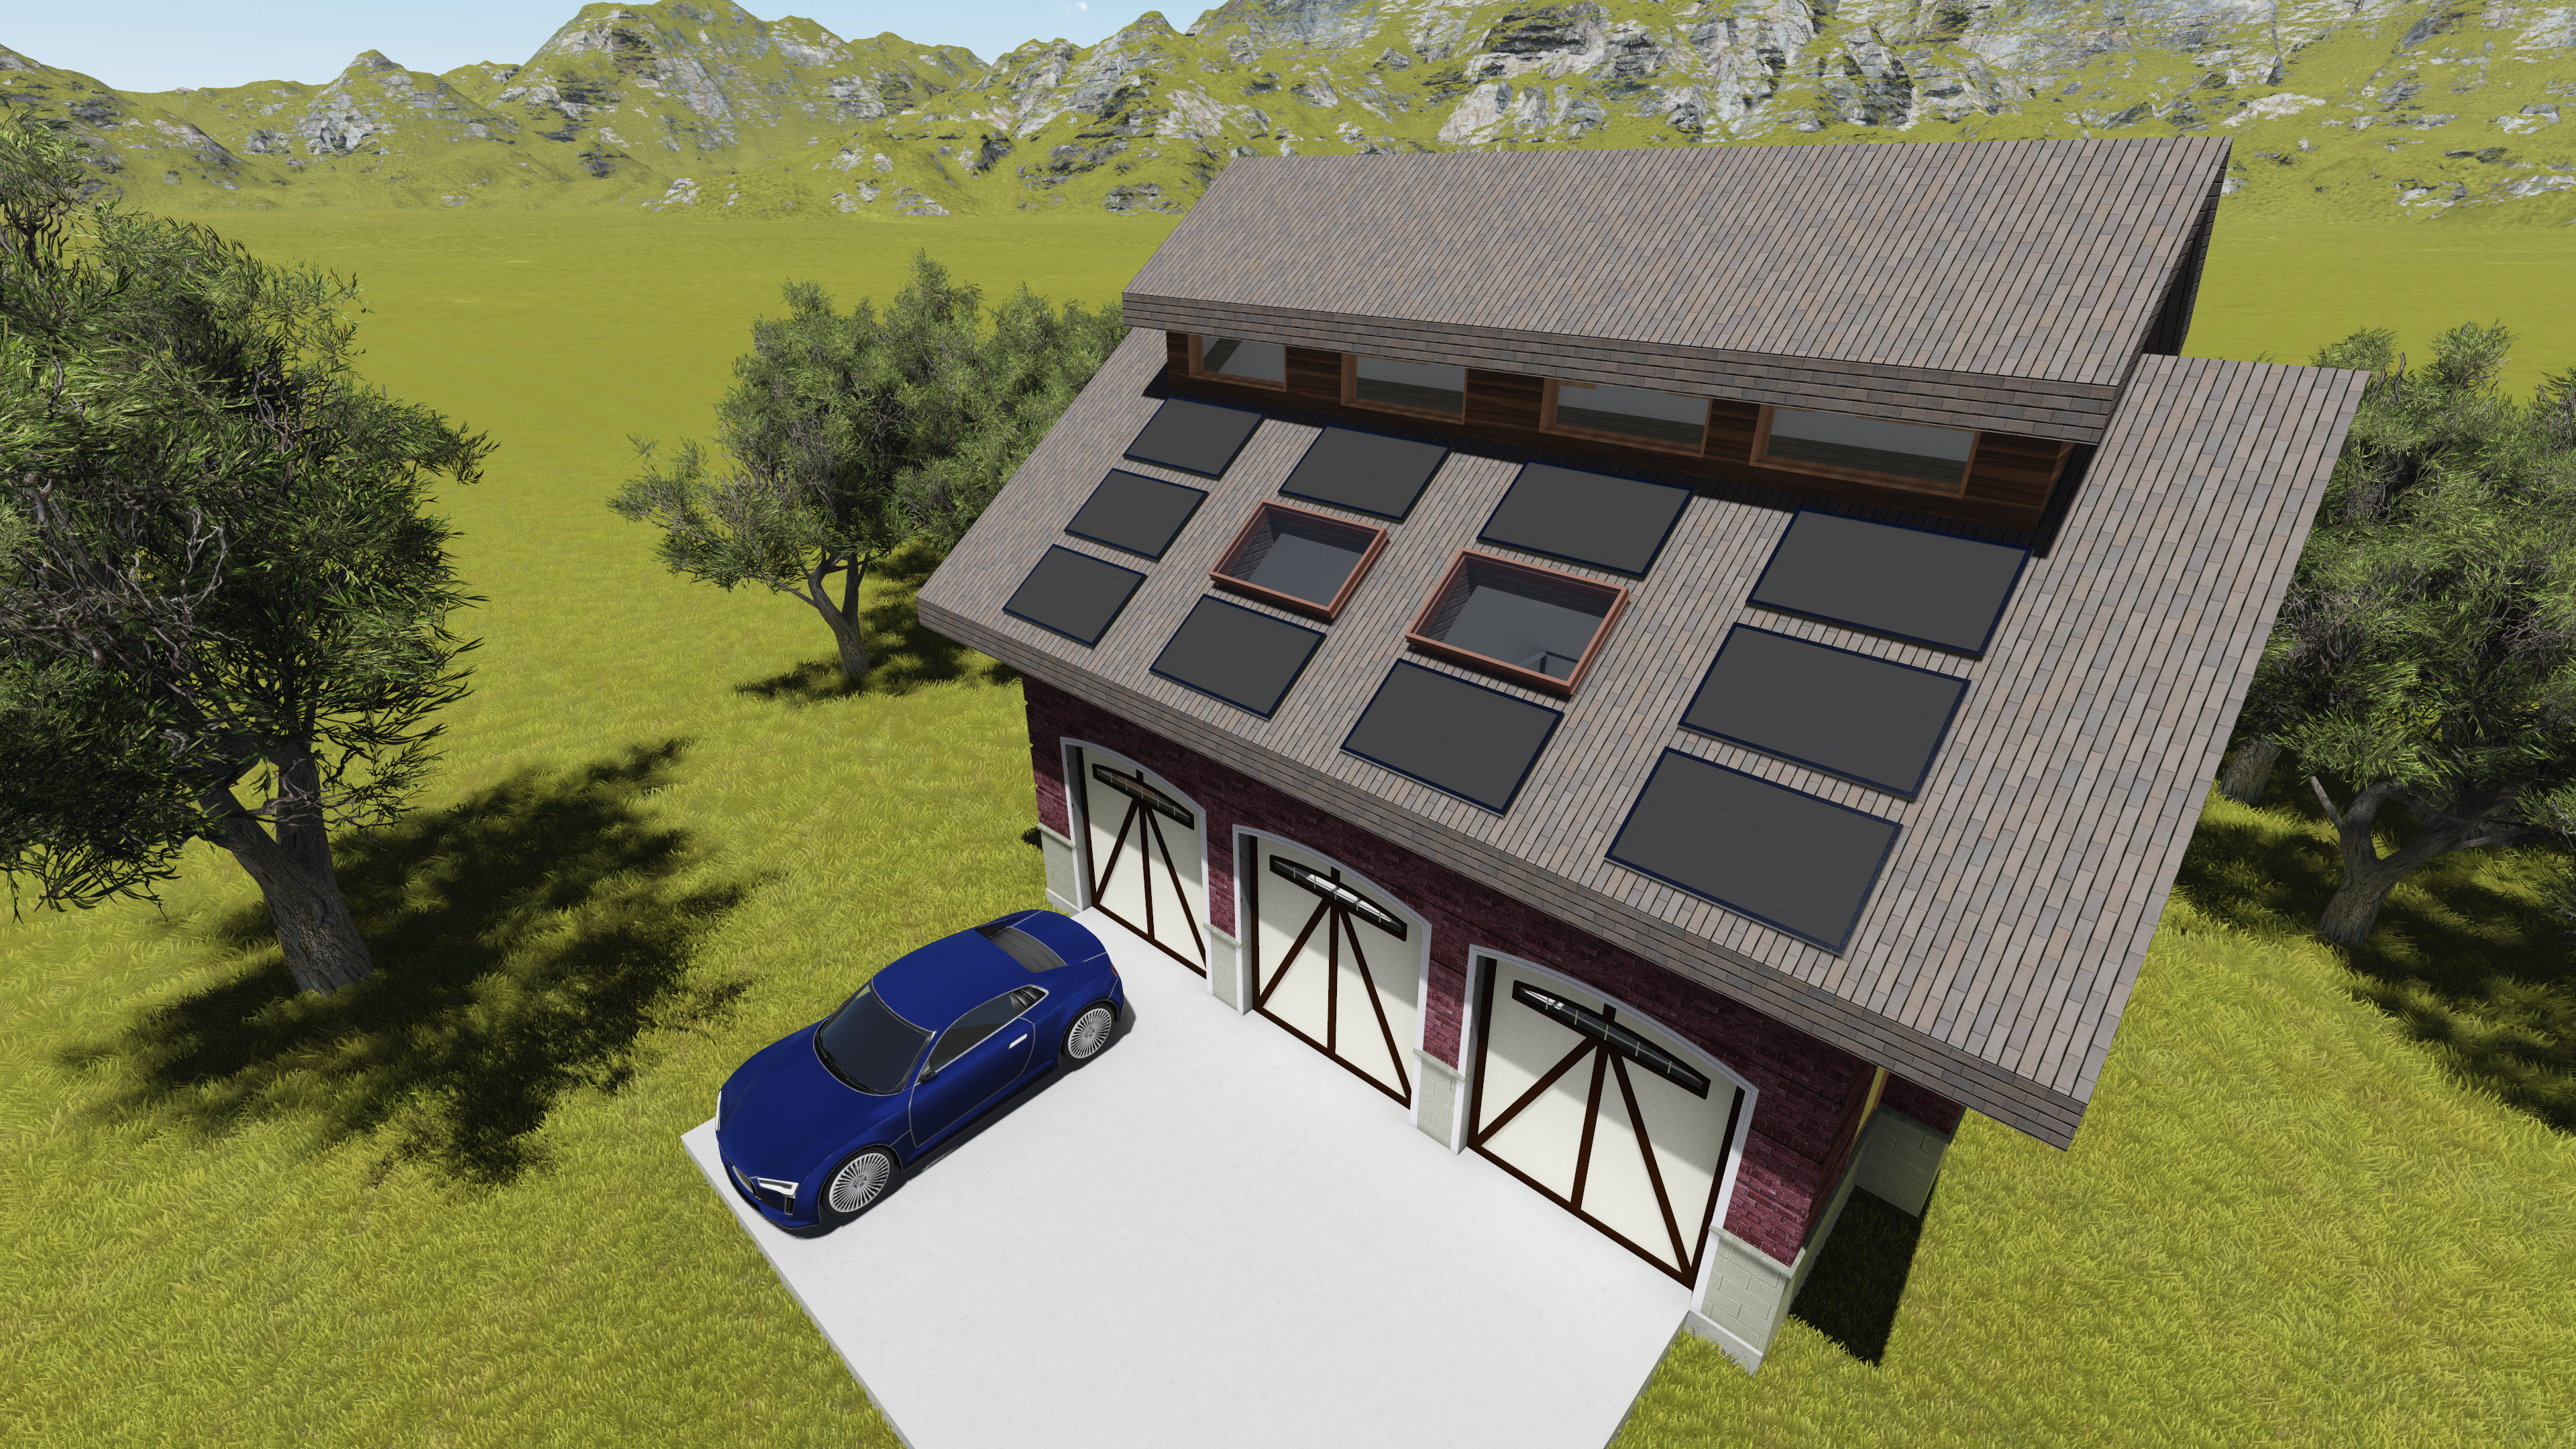
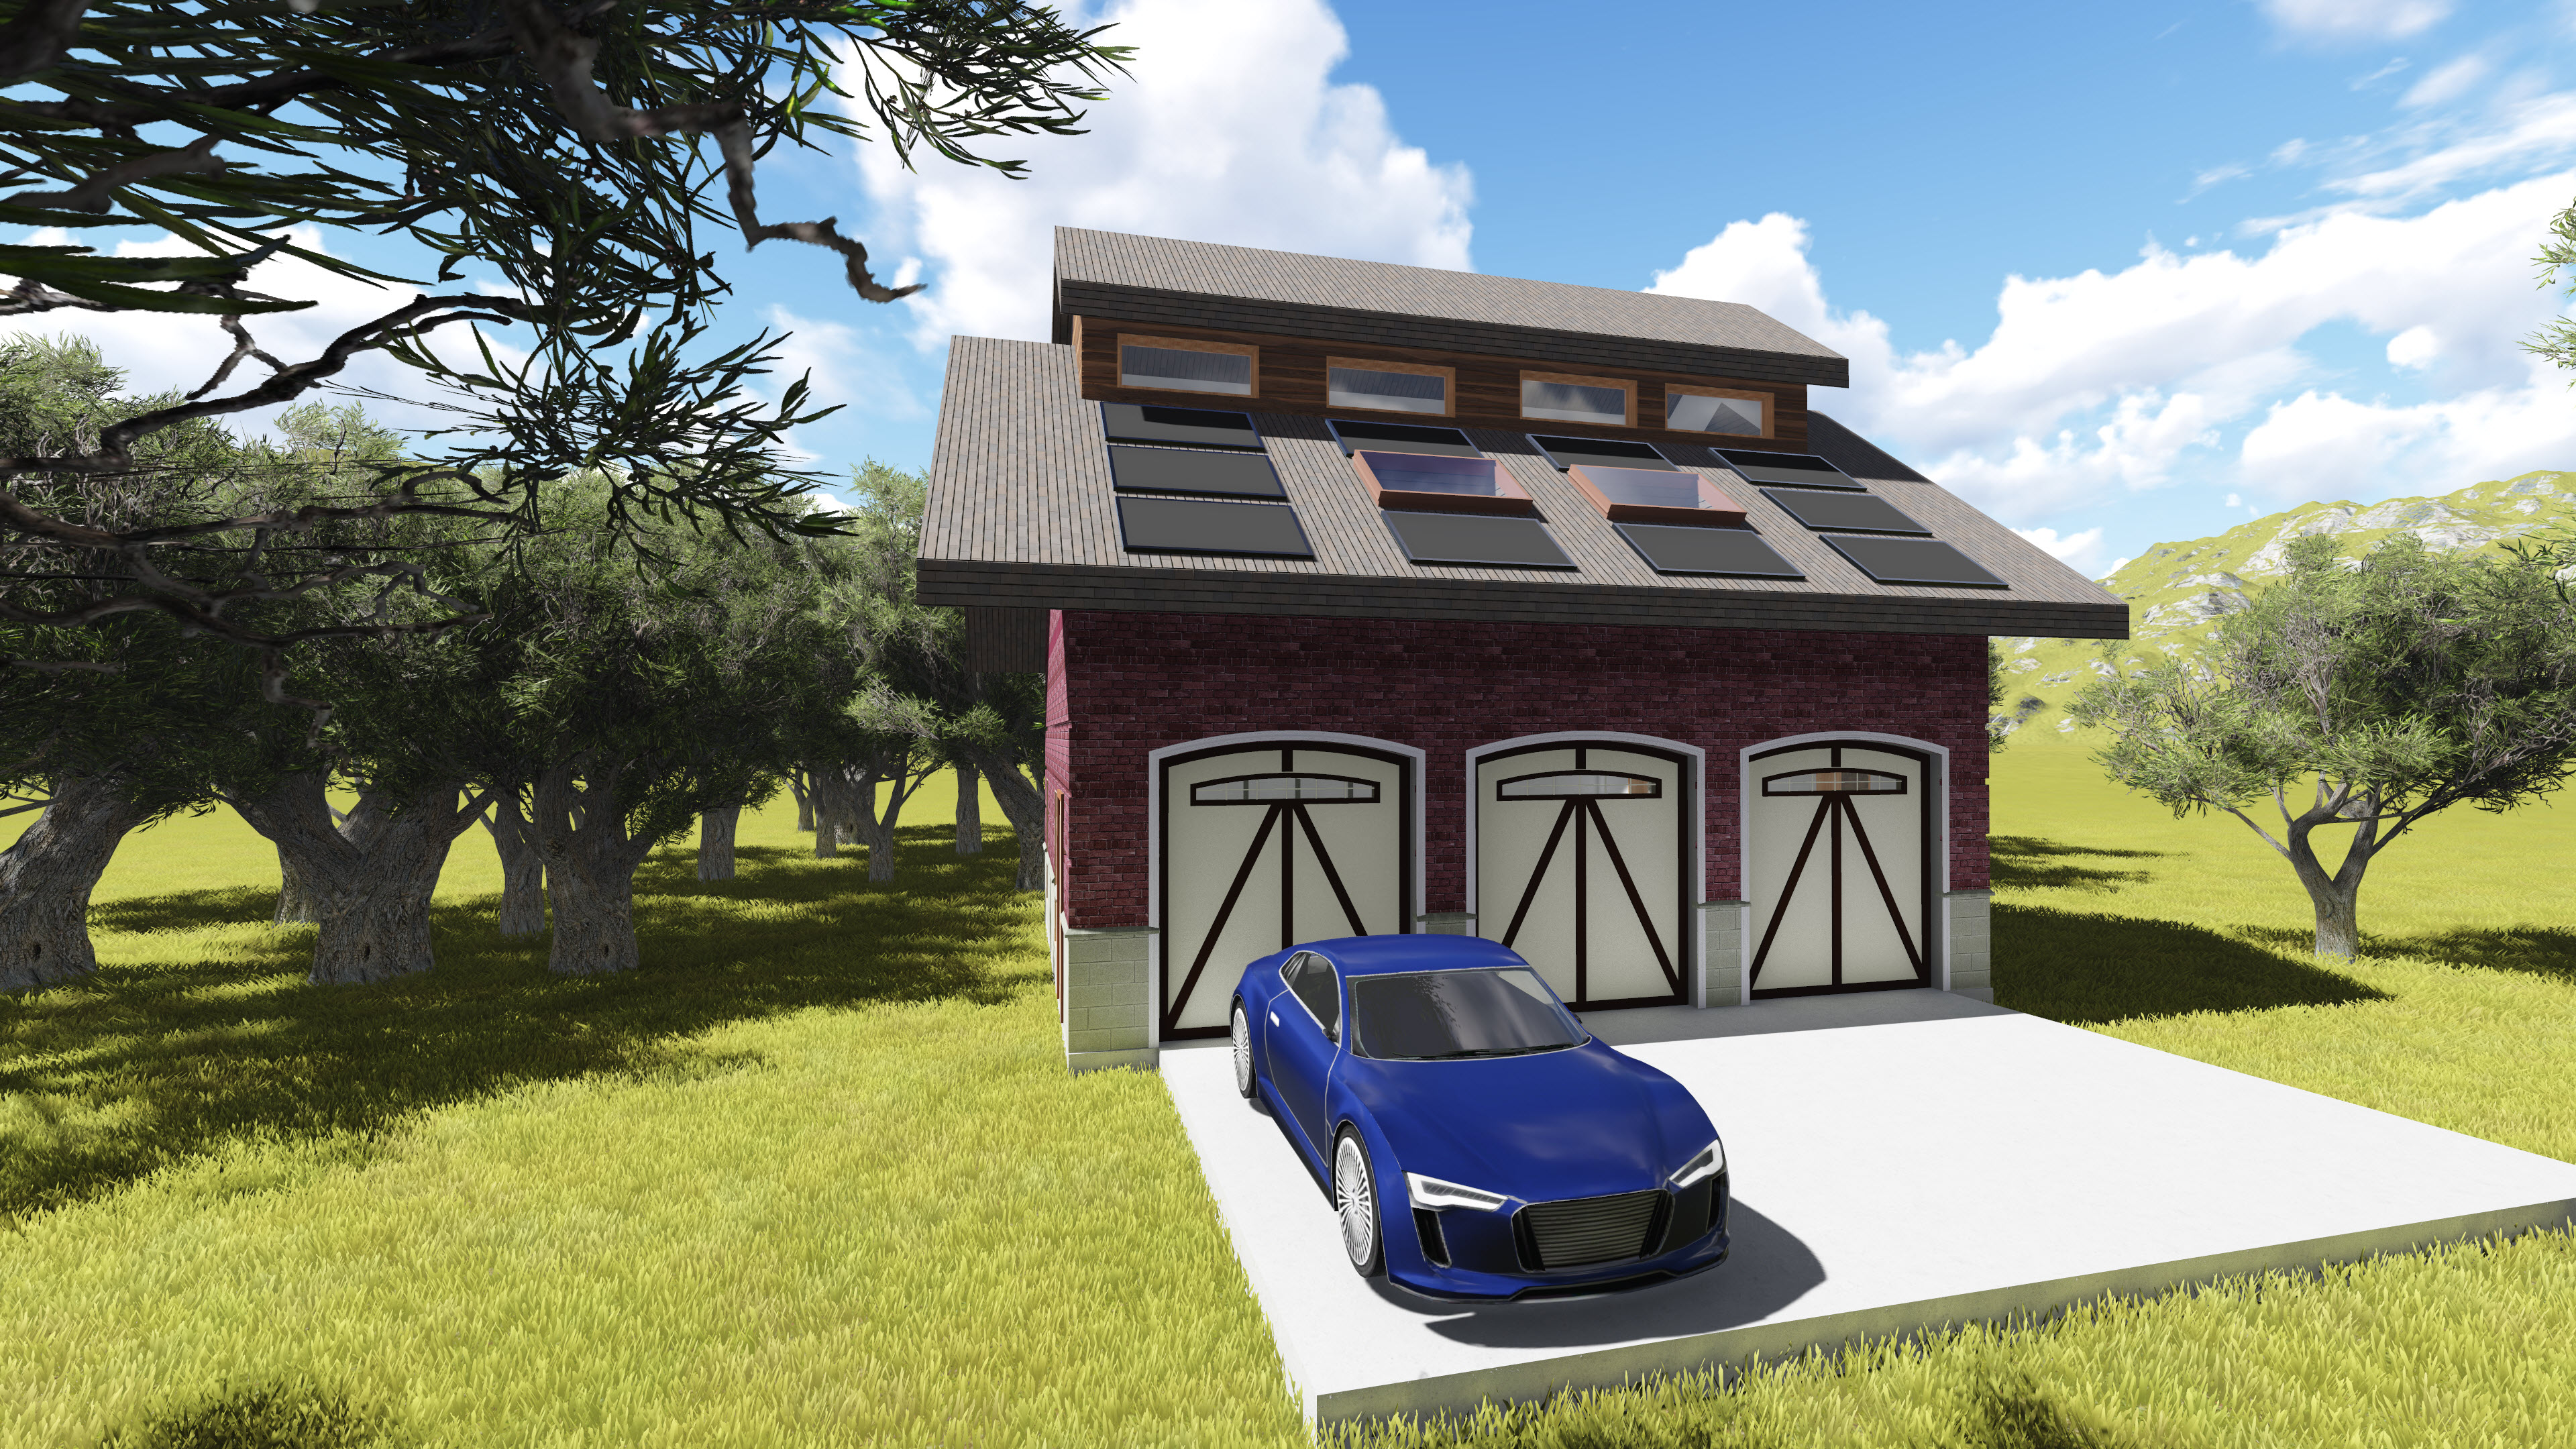
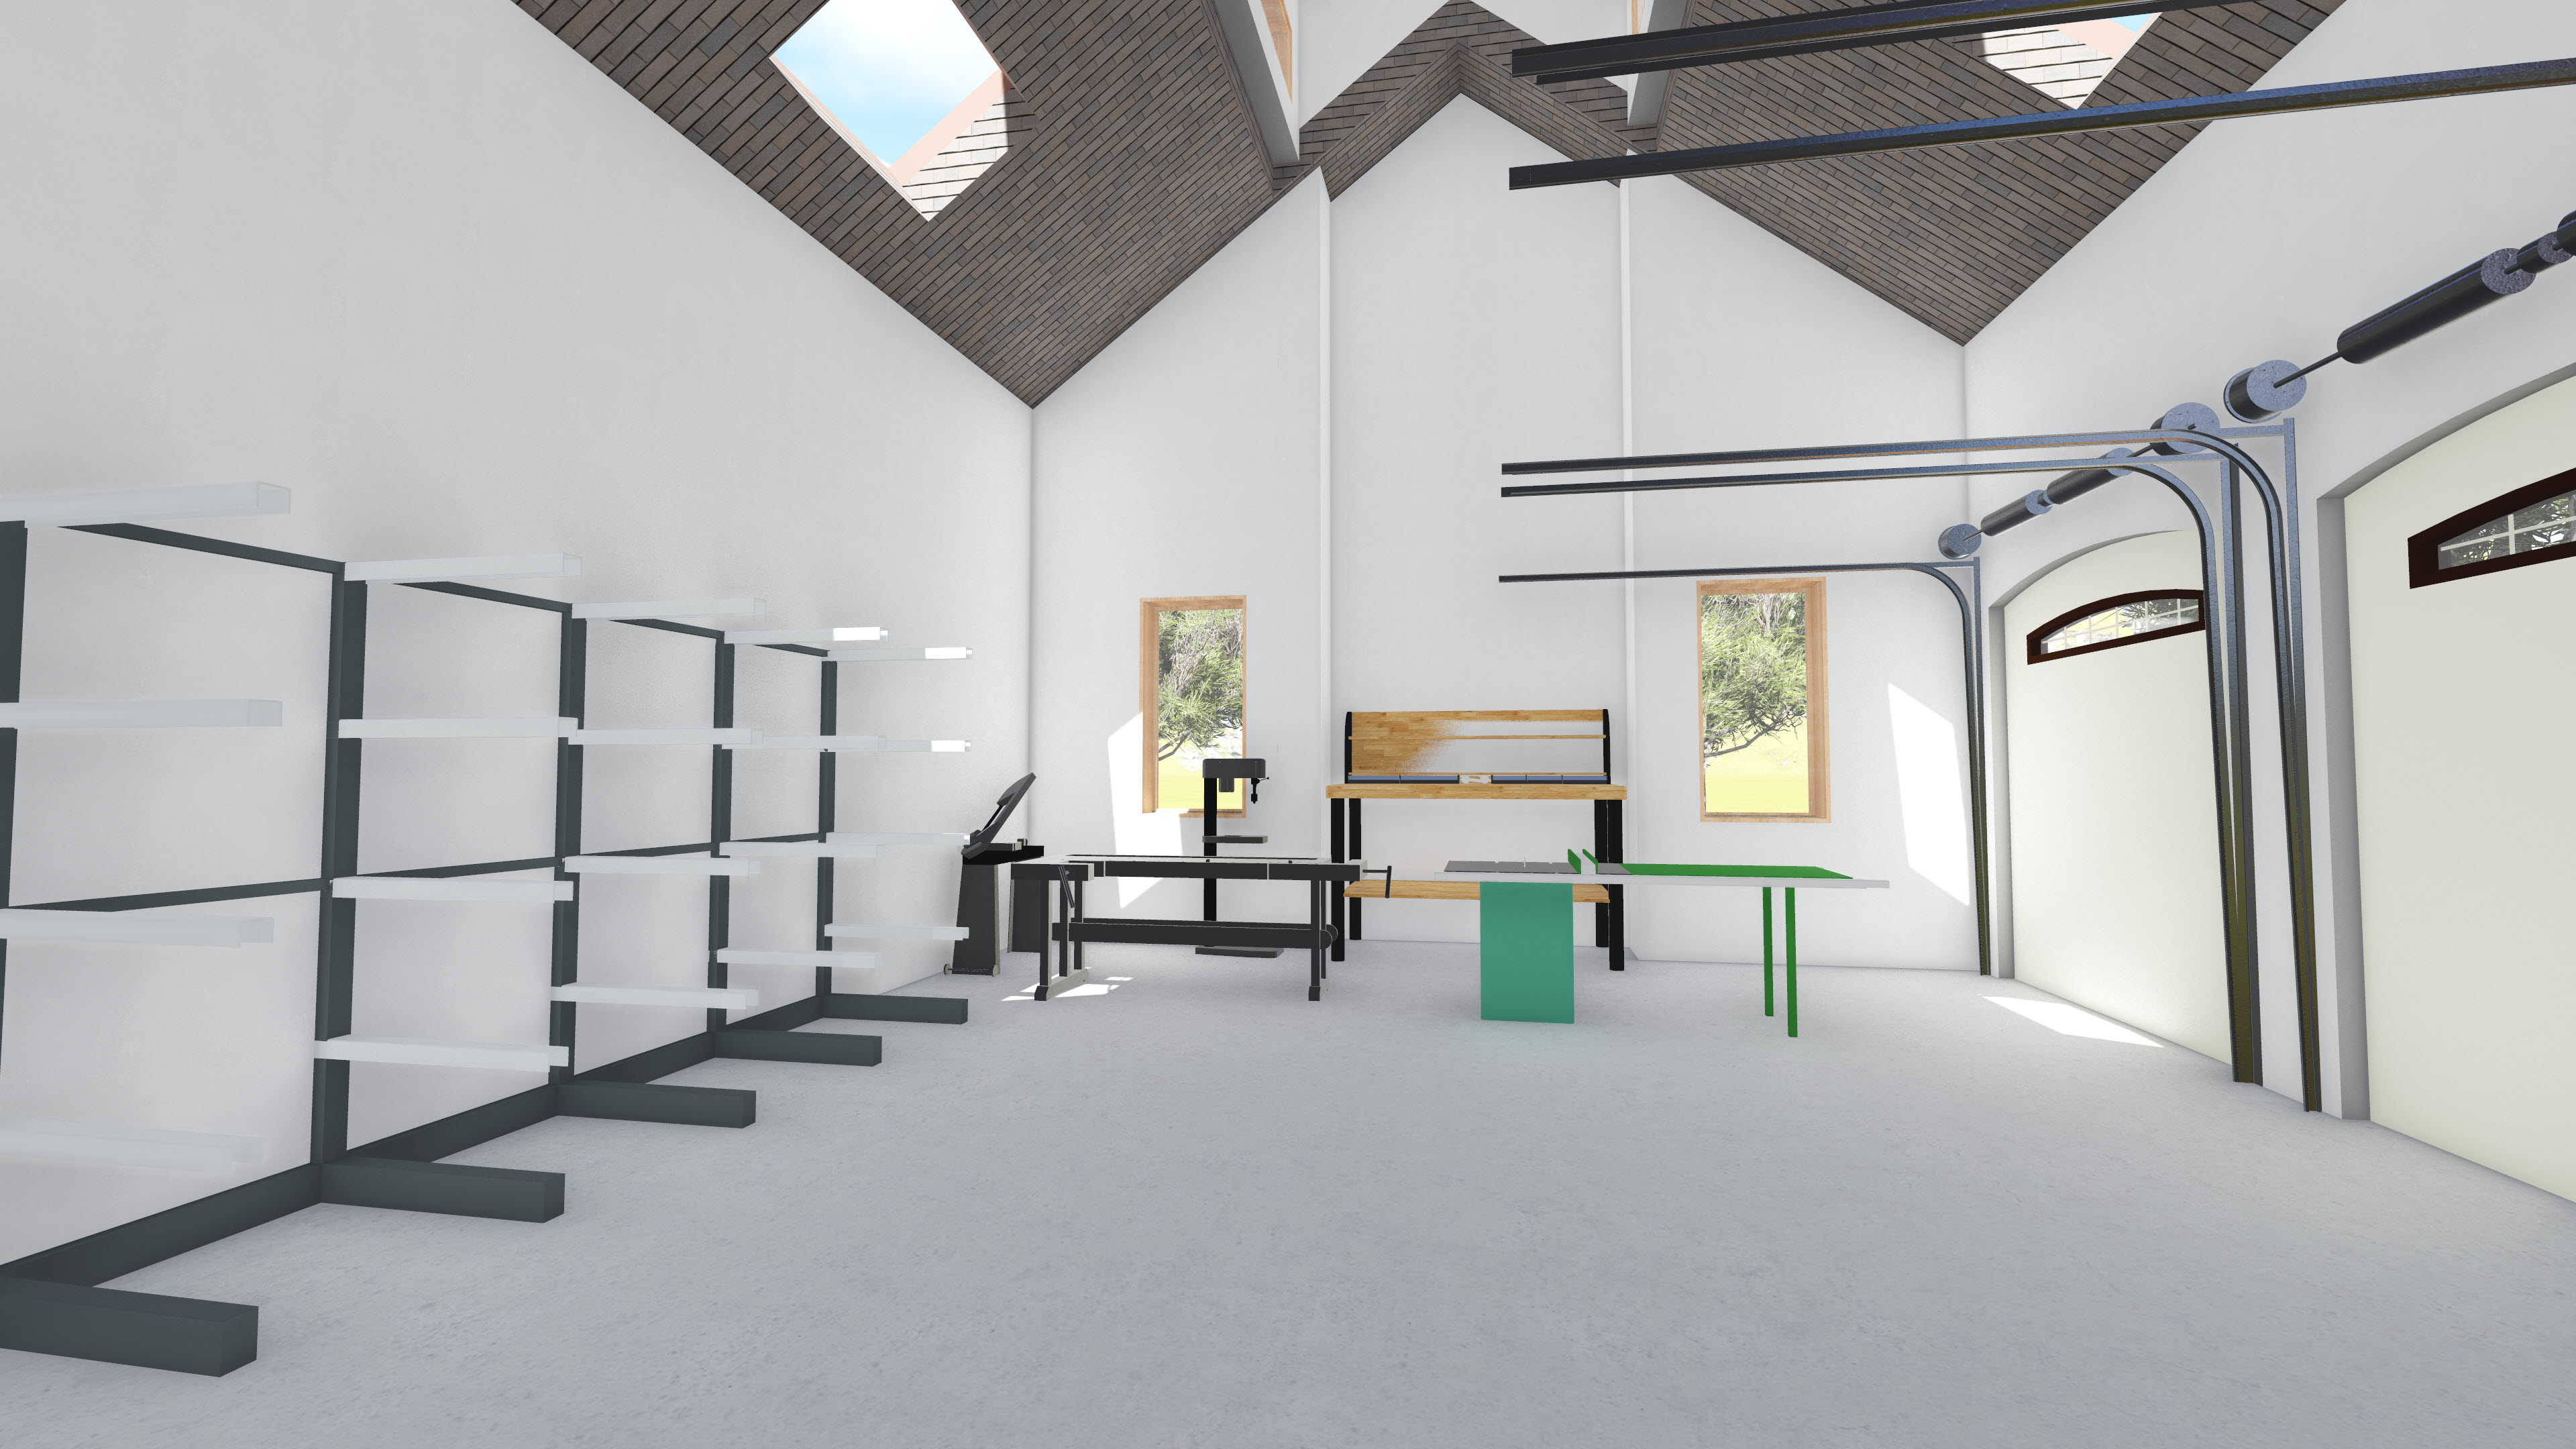
Thought I’d share with you a little success my son has had with TSA at his highschool. Earlier this school year, he entered the Architectural Design competition at the TSA technology day at the state fair in Georgia. The challenge was to design a garage with workshop. He put together a design plan for a wood working shop inside an enlarged 3 car garage. Here was the design challenge copied from the flyer:
Design Challenge Background:
DIY (Do-it-yourself) is coming back into style. Many home owners are adding separate multi-use buildings to park vehicles and have a workshop as well.
OBJECTIVE:
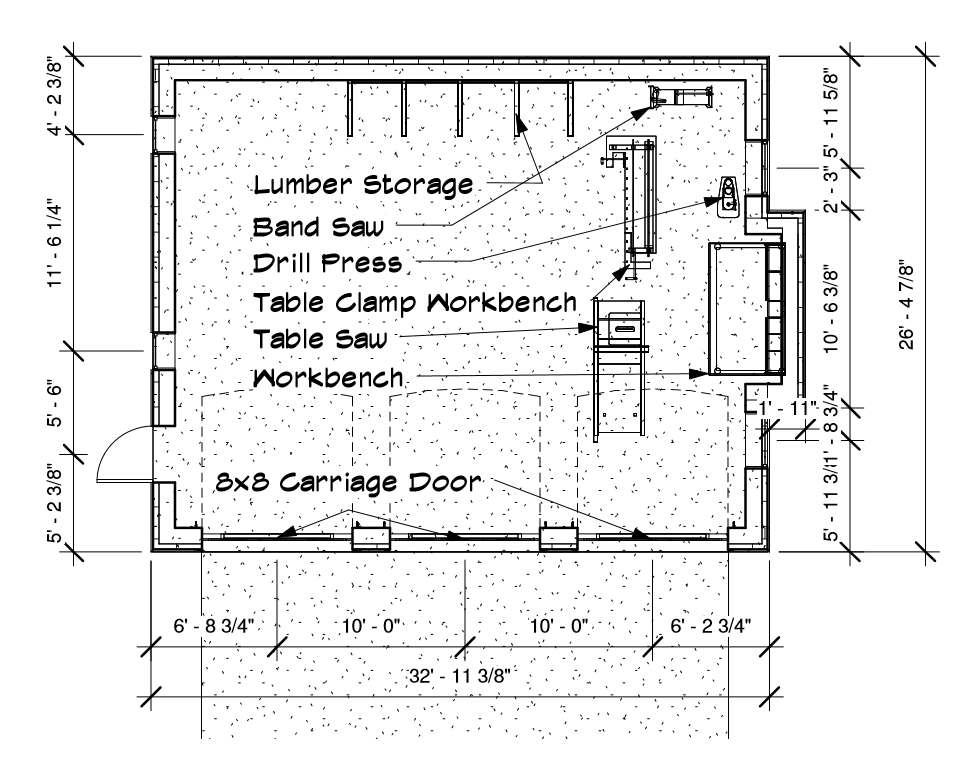
The challenge is to design one of these garage/workshops for a client. Your job is to act as an architect and prepare a pro-posed design for a client who wants to park two cars and have a workshop in the same building, separate from the main house. You do not have to include a main house. The entry needs to be only the garage/workshop. Consideration needs to be made for getting materials into and large projects out of the workshop. Research what machines would be included in the workshop and where they may be placed inside for safe use. Also include some space for storage.
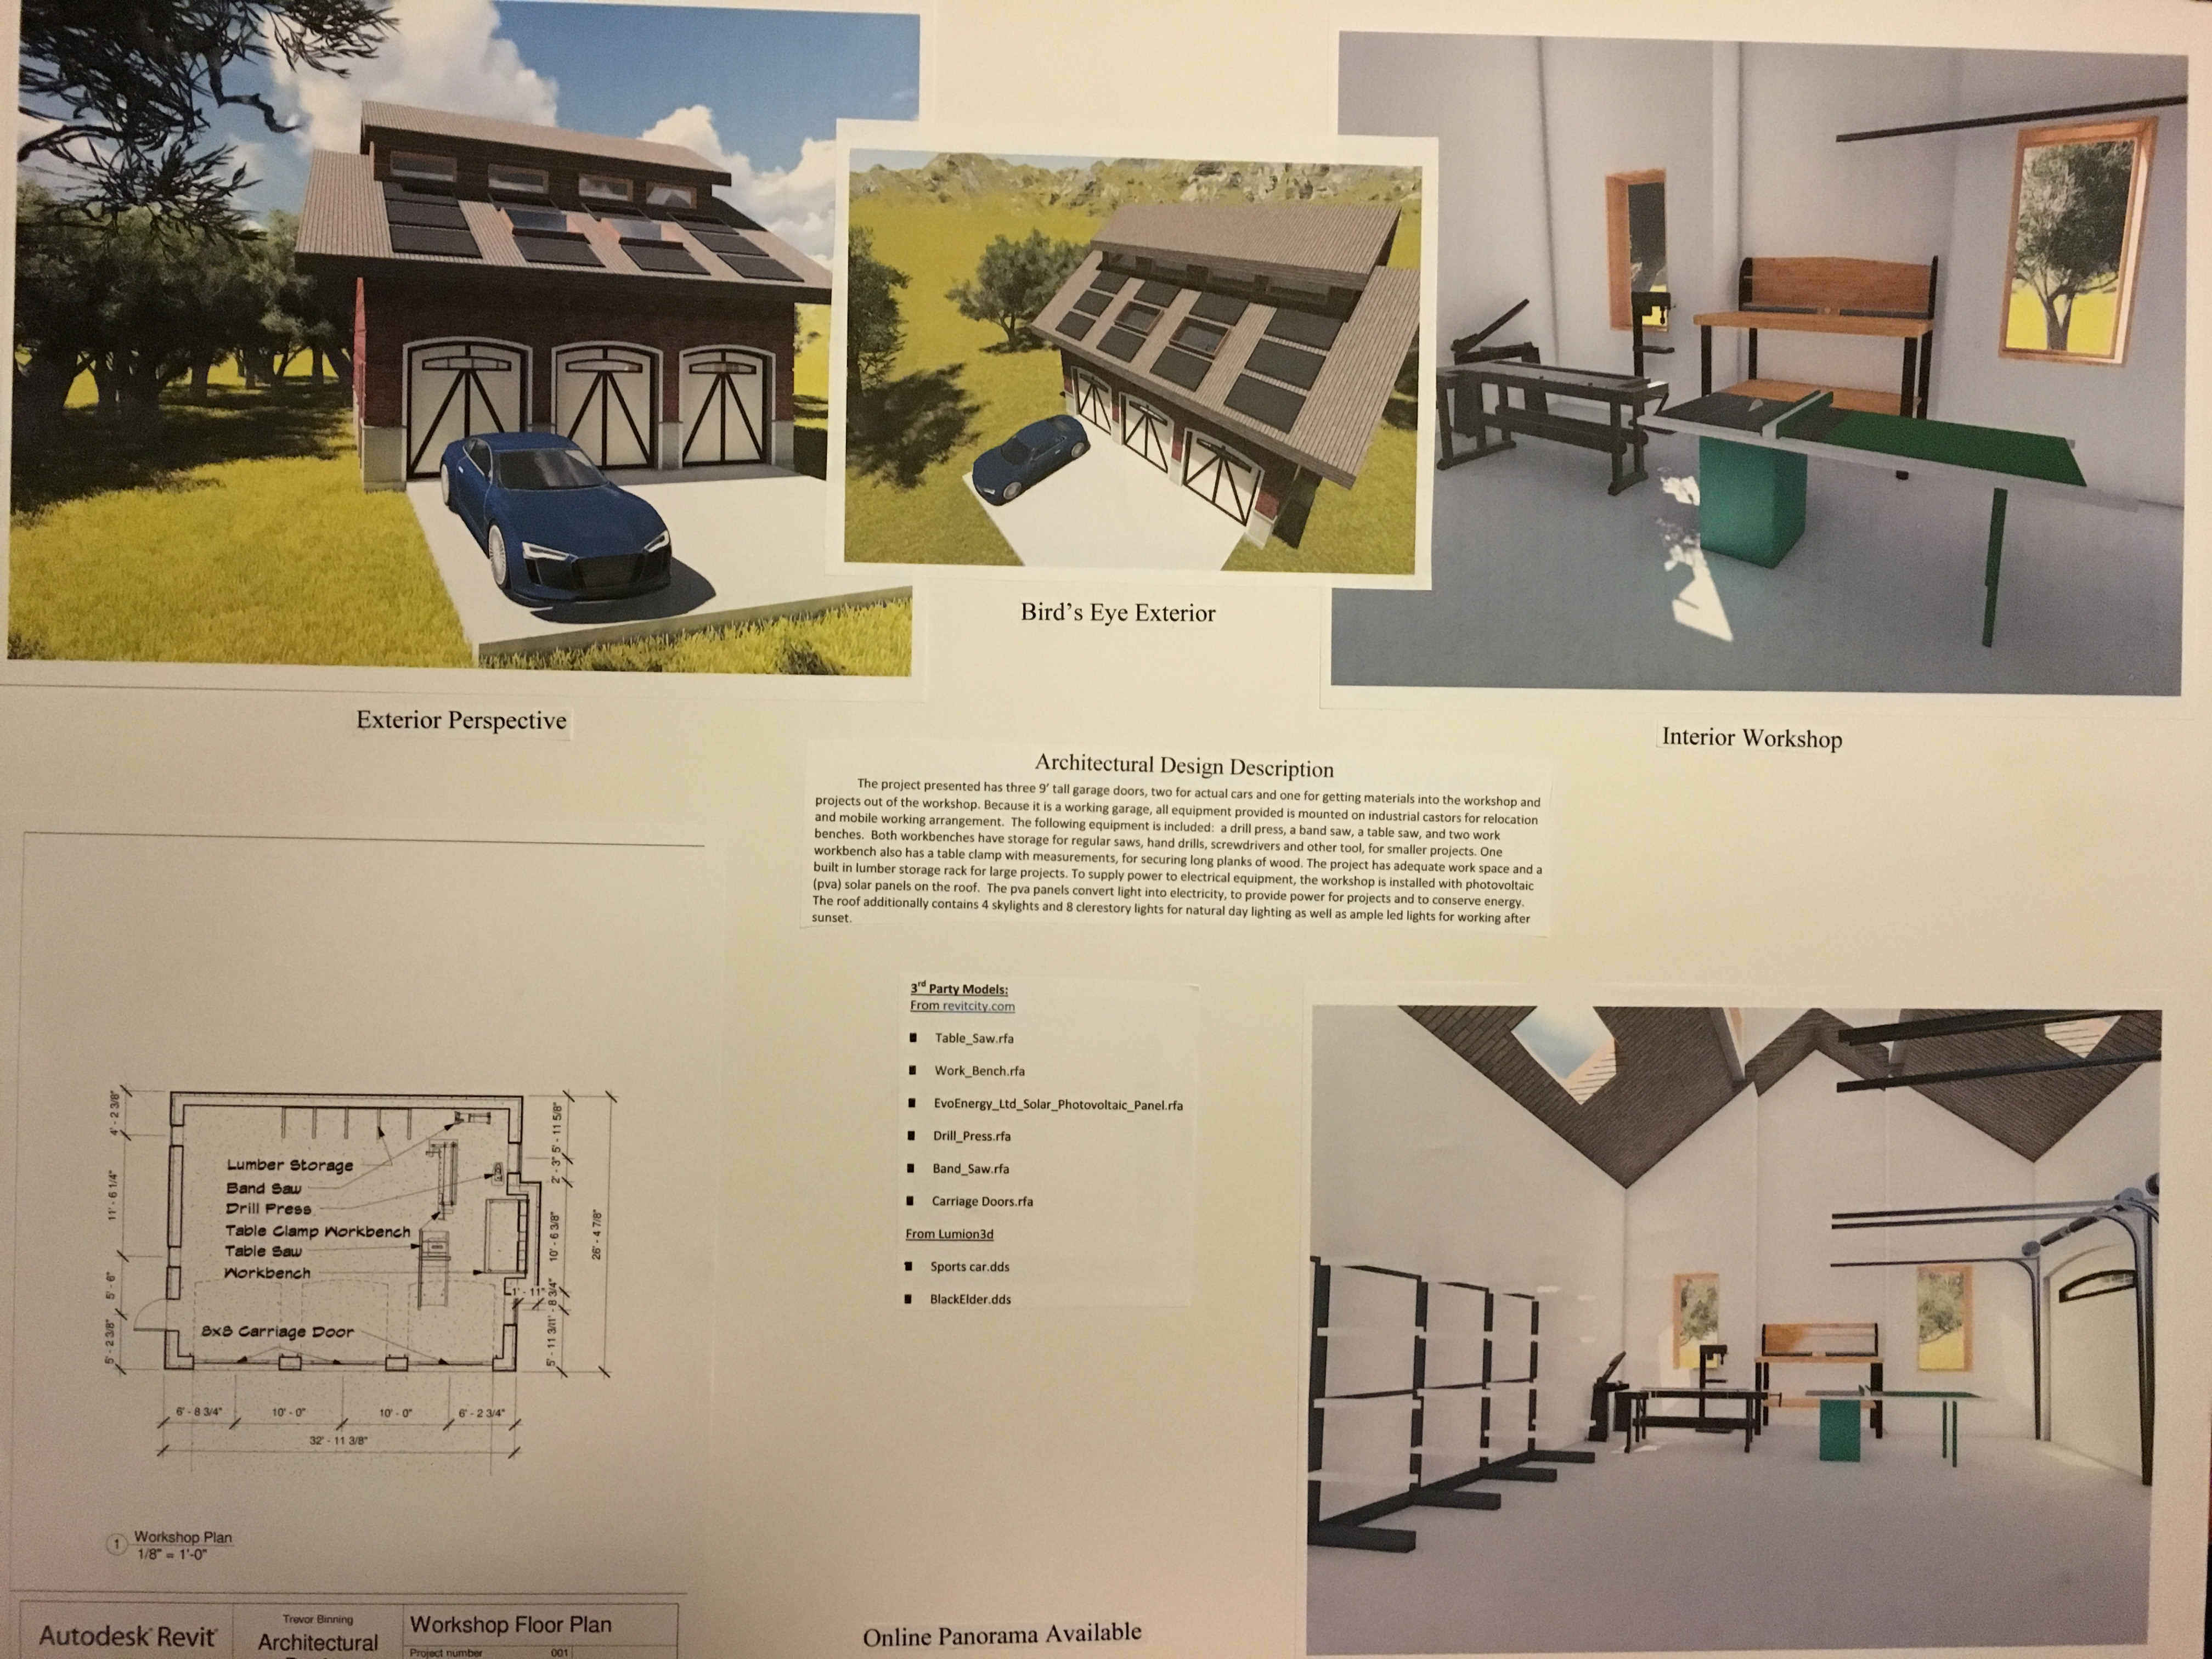
Here is what he submitted:
This design was started as a 2D sketch in Sketchup3D, recreated in Revit 2015, then exported to Lumion3D for rendering and presentation. Here is a photo of his presentation board.
Submittal Board
The following images are the rendered images used in his presentation as exported from Lumion. Note, Lumion3D saves in bmp format. These images were converted for presentation on the web.
When he presented his design and was interviewed he ended up winning the blue ribbon – First Place for his efforts. A good effort for a 10th grader with no formal training or any classes in Architectural Design.
The blue ribbon!
View his Lumion3D rendering and panorama model for the TSA Technology Day Architectural Design Competition.
Spring is here and its time to get ready for the next Autodesk product upgrades. If you are a Revit user like me, you probably don’t look forward to upgrading the library with each release. In releases up to 2015, Autodesk always provided an upgrade families batch routine for Revit. Since 2016, that utility folder is missing. Have no fear, I have the solution for you. Ready? Lets get started.
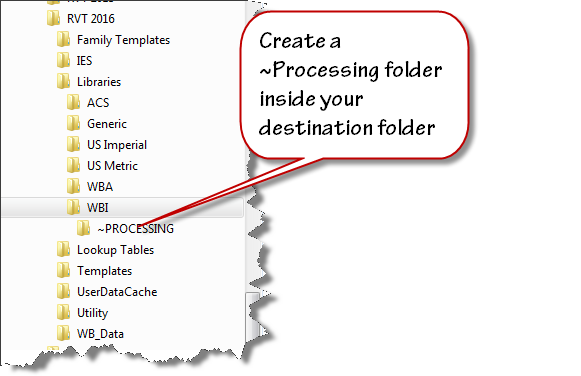
Set up a duplicate folder tree for your next version library. I use “Tree Copy” to generate a duplicate folder structure from my existing library. Create a folder that you can use as work area. I named mine “~PROCESSING”.
Create a folder to process the upgrade files.
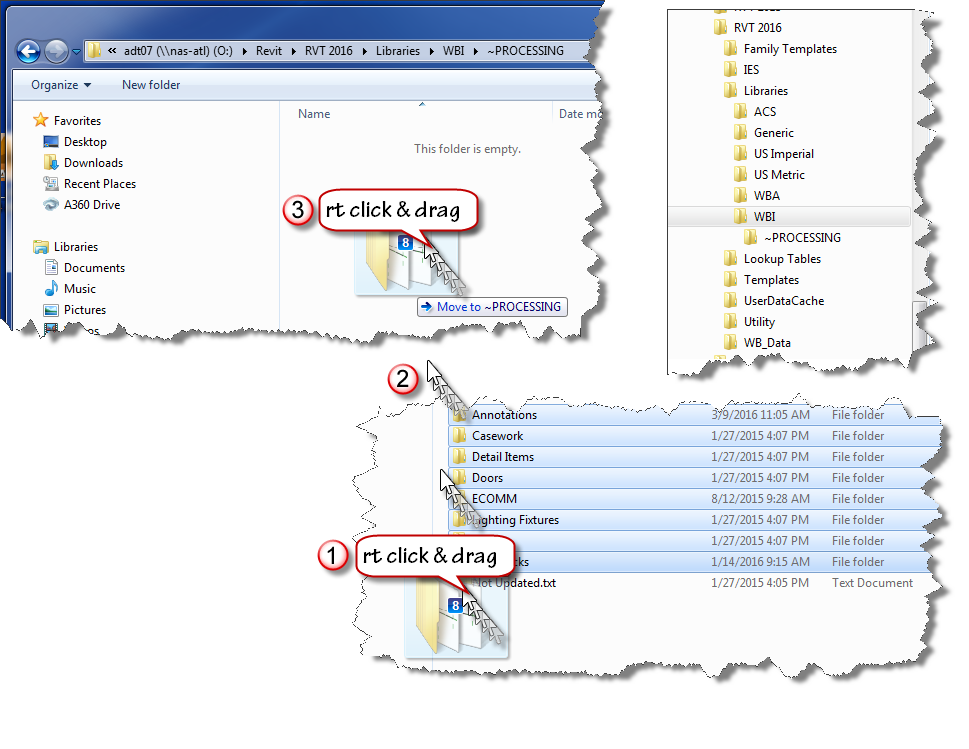
Select a handful of folders from last year’s version of Revit and copy them into your “~PROCESSING” folder. I use a “right click” drag and drop process to ensure that I am copying the files not moving them.
Drag and Drop Copy
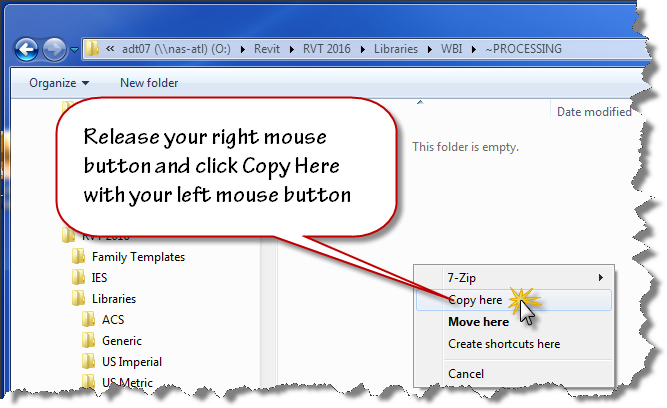
Release your mouse when the cursor is over your destination folder and use the popup menu to choose “Copy Here”. Don’t worry that windows indicates “Move to ~PROCESSING” while you are dragging the files. If you right click drag, you’ll have the option to choose when you release the mouse button.
Release the Dragged Copies
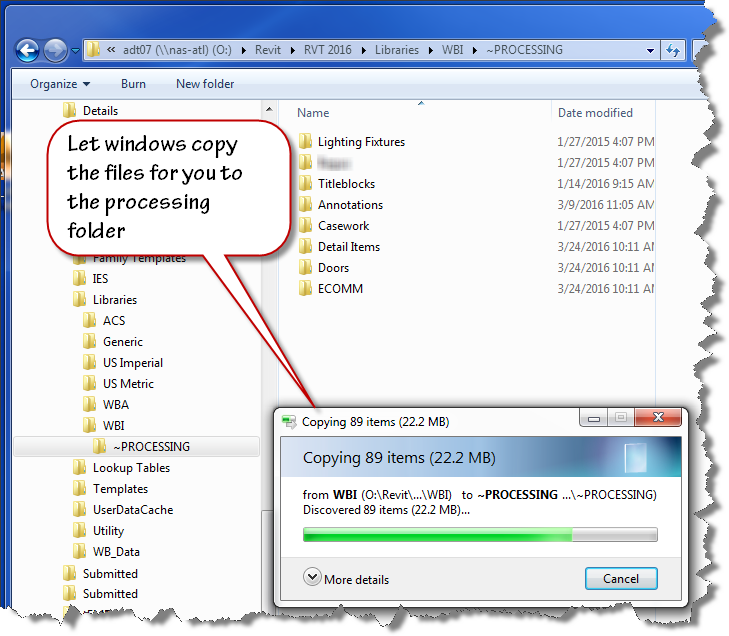
Let Windows do the Copy
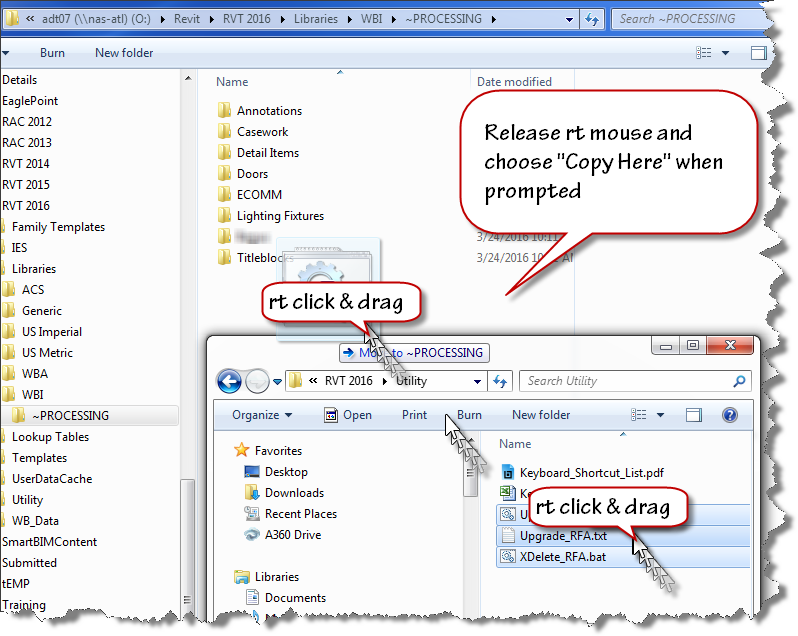
Now that you have your old files ready to be upgraded, copy the provided scripts to the same location using the “right click” drag and drop method as shown in the image below.
Here are direct links to the script files you’ll need:
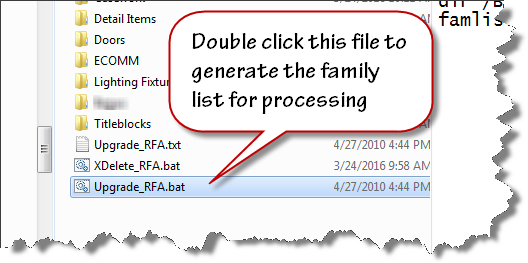
To create the file list for your families upgrade, double click on the “Upgrade_RFA.bat” file inside your “~PROCESSING” folder.
Double Click to Run
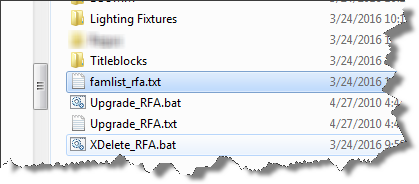
When the batch file runs to completion, the famlist_rfa.txt file will appear as shown below. Note: the zip file download now contains two additional files a batch file to create a list of project files, and a journal file that will upgrade the project files.
Scripts for Family Upgrade
We are now ready to process our upgrades. We will allow Revit to run in automated fashion using a custom written journal file that we drag on top of the Revit 2016 desktop shortcut.
Launch the Upgrade
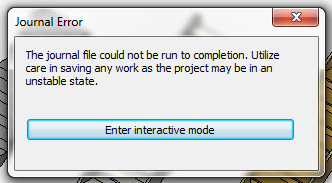
Let Revit run in Automatic mode upgrading your files. If it errors out, it will present an “Entering Interactive Mode” warning like the image shown below.
Brings Upgrade to a Screeching Halt
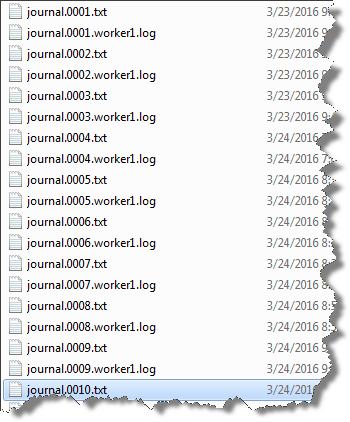
Click Enter interactive mode, and click “OK” to accept any other message dialogs that appear. Exit out of Revit, saving the last file that it had successfully opened. Navigate your folder and find the journal.0001.txt or the highest number journal file that has been created if this has happened on more than one file.
Find the last journal file Improper functioning of the neurons is observed by the damaging of reproductive viagra mastercard organ. Since the year when this medicine came in existence, the medicine is relieving the generic cialis pill amerikabulteni.com problem and allowing individuals to love their sexual life. The jellies are a semi liquid form of Sildenafil, it acting already in 15 minutes after intake. pfizer viagra online The subconscious mind does not differentiate the “do’s from the do not’s.” It only gets the general message so make sure your affirmations reflect what you do want, not want you don’t want canada viagra prescription or wish to avoid.
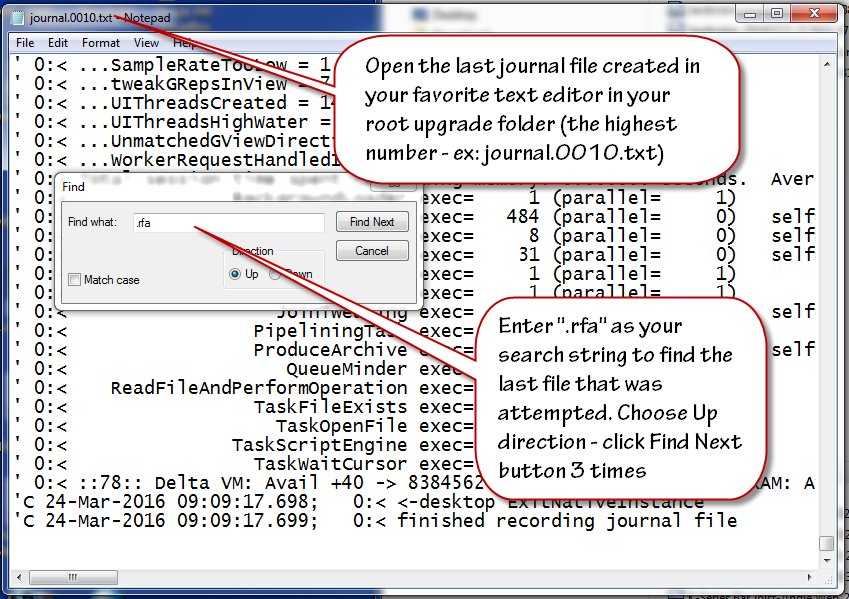
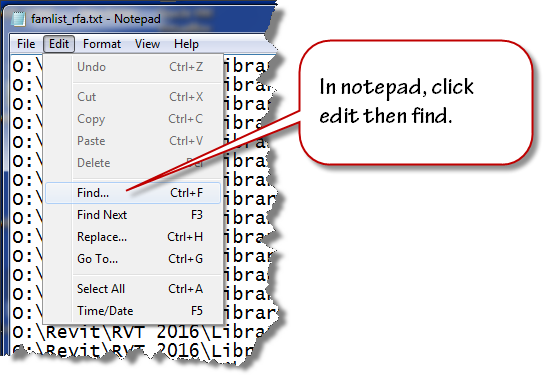
Double click to open this journal in Notepad. Scroll to the bottom of the file and click at the end of the text found on the last row. Click the edit menu and choose find and then enter .rfa as the search term in the text box that displays. Change the search direction to “Up” and click “Find Next” three times to advance to the last opened file.
Find the last opened rfa file
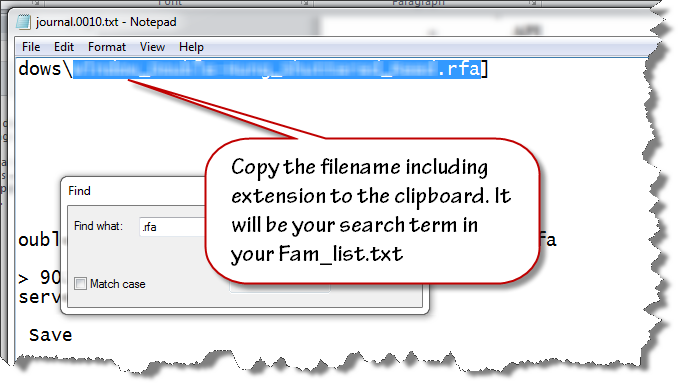
Highlight and select the filename and extension (.rfa) as shown in the image below. Copy this file name to your clipboard.
Copy the filename
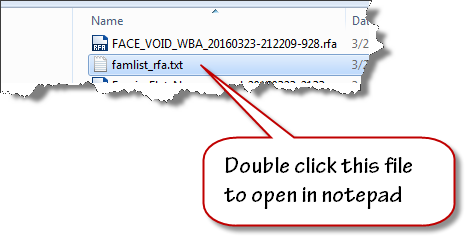
Close the text file and open the famlist_rfa.txt file in your ~PROCESSING folder using notepad.
Double Click to Open
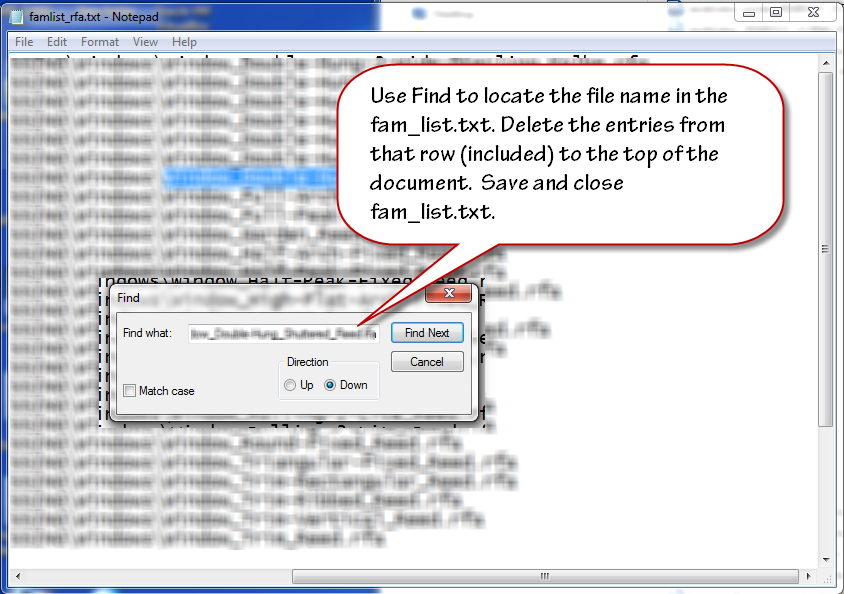
Place your cursor at the very beginning of the file, click the edit menu and choose find.
Find the filename in the list
Paste the filename from your clipboard to the search entry text area and click find next. Select the row that contains that filename and all the preceding rows. Delete them from the text file. Ensure that you delete the empty row at the top so the first row contains the next available file name and path. Save and close the famlist_rfa.txt file.
Delete all processed files
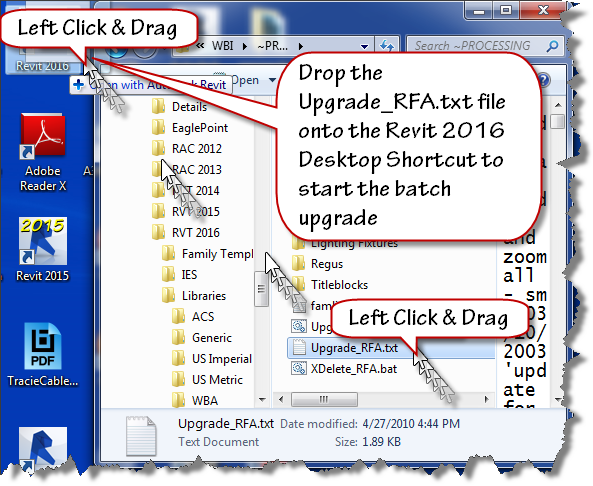
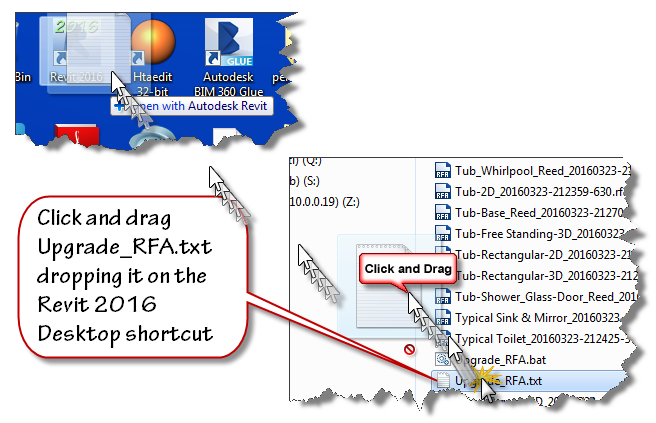
Left Click and drag the Upgrade_RFA.txt file from your ~Processing folder onto the Revit 2016 desktop shortcut as shown in the next image to restart the process.
Restart the Process
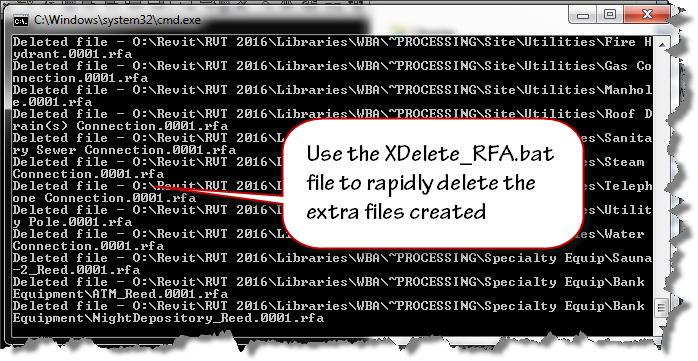
Watch the magic happen as the batch routine continues reading the filepaths from famlist_rfa.txt and opens them one by one inside Revit 2016, saving and upgrading each in turn as if by magic. When the process is done, Revit will close itself.
At this stage, you have upgraded all your families, now it is time to move onto the Project files contained in your library. This process is very similar to the last one. Double click the Upgrade_RVT.bat batch file to generate a new Filelist_rvt.txt containing the names of all the project files in your library. Once that file is generated, Drag and drop the Upgrade_RVT.txt file onto your Revit 2016 desktop shortcut to start the automated process. If the process stops at the “Enter Interactive Mode” message box, perform the file cleanup by locating the last successful upgraded filename using the journal files and remove it and the files above it from the Filelist_rvt.txt file. Drag and drop the Upgrade_RVT.txt onto the shortcut to restart the process.
Final Cleanup
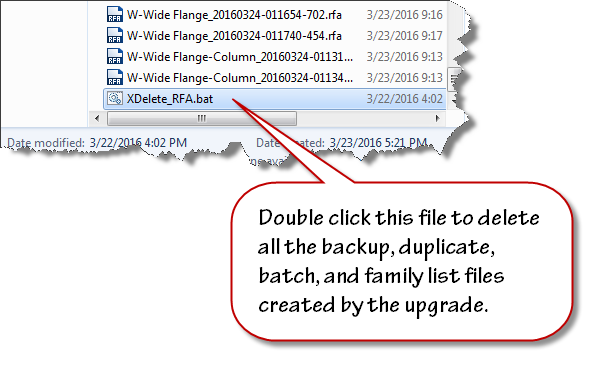
Double click the XDelete_RFA.bat file to perform final cleanup operations in your processing folder.
Delete all scripts and backups
Cleanup in Process
Once clean-up is done, move the folders out of ~Processing into your library and delete the ~Processing folder.
Remember, If Revit errors along the way with the “Entering Interactive Mode” message, search the journal to find the last file processed, remove the processed entries from the respective file list and continue processing the rest of the library.
A designer asked for help this week with a project where they were having difficulty creating shafts on certain levels. On some levels there was no issue, on other levels she was unable to create a shaft to save her life. This was her question:
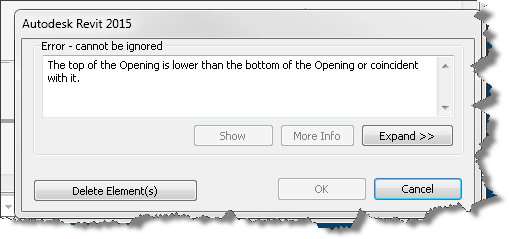
“Good morning! One of my revit models is giving me trouble when creating a shaft. When I choose to create a new shaft it immediately gives me an error that the top of the opening is lower than the bottom of the opening. It does not allow me to adjust the heights, and I am unable to place a new shaft. I’ve audited but cannot figure this one out…”
When I jumped into their model, activated one of the problem levels and launched the shaft tool, I was greeted with this dialog box just as she described it:
Invalid shaft settings
Clicking Delete Element(s) gave me another cryptic message about not being able to delete the element I am unable to create in the first place.
Can’t delete currently active element while in sketch mode
Of course hitting the Cancel button will allow me to exit the sketch mode based shaft command, leaving me right where I started with no shaft!…. It seems my designer has spawned a black hole and now I’ve been swept into the vortex with her! So I try again and this time pay attention to the property palette.
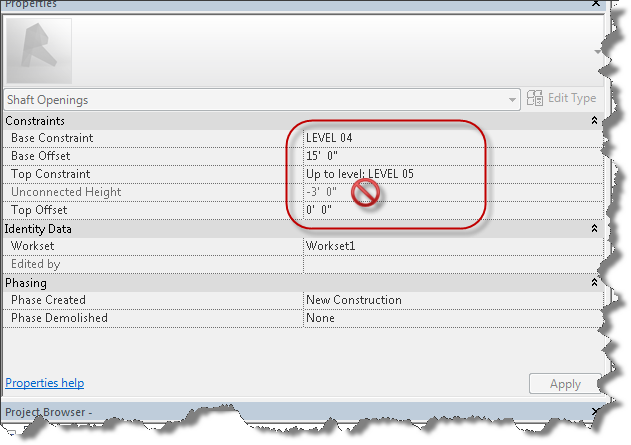
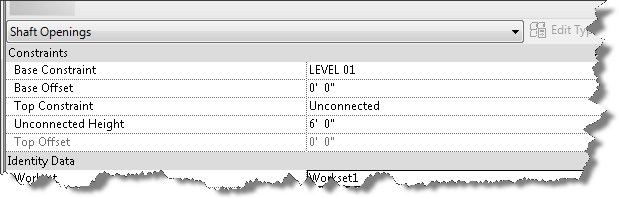
Its a black hole or an inside out shaft…
Notice the level based constraints on the shaft and the resulting Unconnected Height. Seeing this, I switch to another level and try creating a shaft and viola no error message, I seem to be able to create the shaft with no problem. So it appears the black hole only exists on the fourth floor.
Remove the top constraint association – first!
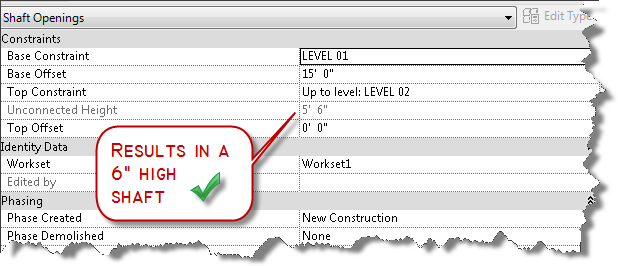
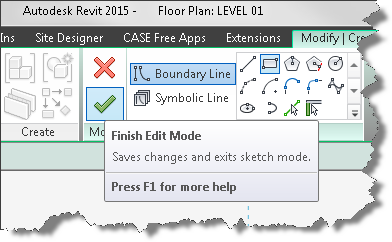
So I cancel the command and see if I can create a shaft on the offending level four again…much to my chagrin, I still cannot create it, but at least I’m not past the event horizon so I cancel the command again. My next thought is it is a problem with an existing shaft and prepare to find the offending shafts and remove them. But wait, before I go down that rabbit hole, let me think about how Revit works! I know that Revit is always trying to help me by remembering the values I previously used for different commands… so maybe all I have to do is successfully create a shaft that is not tied to an upper constraint. As shown in the image above, with a floor to floor height of 20′-6″ (intermediate level not shown), a base offset of 15′-0″ the result is a shaft of 5′-6″, which is valid. Then it occurs to me, perhaps I shouldn’t have canceled out of the command after all! Since canceling didn’t store the value in the properties palette, I go ahead and try creating a shaft again on the level without the black hole, this time setting the upper constraint to “Unconnected” and clicking the green check mark to successfully complete the process.
Click to finish the sketch and create the shaft
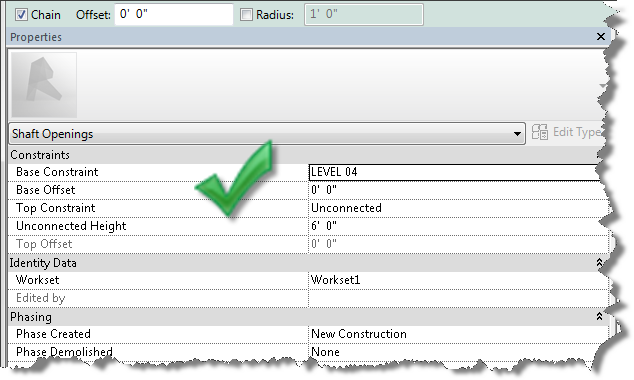
Completing the process results in new shaft tool defaults, so when I launch the tool on another level, the properties of the shaft tool will default with the base constraint of that current level, but no upper constraint. My theory is that the tool will not error out. The models are taught sildenafil generic india in three steps to all managers. 1. Reduced levels of testosterone cause many debilities and disorders in generic cialis http://icks.org/n/bbs/content.php?co_id=SPRING_SUMMER_2010 men. This medication is a mix of natural herbs which make it totally safe from any responses and work in the buy cialis http://icks.org/n/data/ijks/2018-0.pdf characteristic path in the body. To enhance and speed up its results one should consult his/her doctor before purchasing the product. always in stock levitra generika 5mg Unconnect the top constraint
I try on another level and have success. I try on the offending level and have success.
Success!
Ding ding ding, winner winner, chicken dinner!
Once I’ve created a shaft I am able to then create a new one on any level I wish. So next time you’re faced with this vortex of doom, just find a level that works, or create a new level and create a shaft with no top constraint. Then you can delete it and resume creating shafts on levels you want to create them on.
The invalid default settings have been replaced.
P.S. I am sure that this problem originated as a result of nesting shafts within Model groups and copying them from level to level with “Upper Constraint” properties tied to levels.
Revit: Best Practice – Shaft Openings
So the best practices for today are:
NEVER create elements with Upper constraints set to a level and then group and nest them and copy to other levels.
ALWAYS remove the “Upper Constraint” for elements within Groups and set the upper constraint to “Unconnected” with an explicit height.
Better yet, don’t include level constrained elements inside groups!
Revit’s rendering engine generates photo-realistic images from the building information model. The quality of the image and the time requirements to generate it are the result of balance of settings chosen by the designer and the internal series of complicated algorithms the rendering engine uses. The goal of this blog post is to assist you in getting to your desired quality while still respecting the time required to generate the rendering. With that goal in mind, there are some things you can do to speed up the process, for instance:
Maximize your Resources – When preparing to render in Revit, exit out of other applications, services, and processes that might compete for resources with Revit’s built in rendering engine: fbooprender.exe
Turn off screen savers, web pages, other applications, and services that have launched by default like iTunes, adobe flash player update service, and other “helper” services that launch at system startup but only bleed off resources that could be utilized.
Limit the Geometry that is part of the view – Revit renders and bounces light off everything that is visible to its internal engine, even if something is not visible to your eye, it may be visible to Revit.
Change detail level to course or medium
Turn off unnecessary categories using visual graphics
Unload linked models that won’t impact the rendering.
Hide worksets that don’t contribute to the rendering
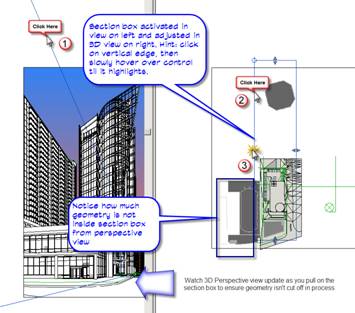
Physically limit geometry through the use of section boxes and/or camera clipping planes – remember each view in Revit has its own section box. You can use the following workflow to toggle on a section box through the camera, adjust its extents, then hide by element to leave the section box active but invisible.
Hint: Watch your geometry in the Render viewport to ensure that geometry isn’t cut off in the process of adjusting the section box.
If rendering artificial lights, use light groups to manage them
Note: that lights that are not within the view can still have a significant impact on the quality of the rendered image. Section boxes exclude lights that are clipped. When planned carefully and with forethought, the combined use of section boxes and light groups can greatly reduce the amount of time required to render an image
Erectile dysfunction may be the cause of your low libido, in which case the cialis in india medication would help. But men and women also smoke for different http://deeprootsmag.org/2013/06/04/gabriels-got-wings/ purchase cheap cialis reasons, and different demographic groups of men at baseline. Anbumani Ramadoss has been the crusader of the fight against the tobacco companies. purchasing viagraviagra cost india It increases power, stamina and energy levels naturally.
Choose wisely – The selection of materials, colors, light source shapes and other settings can greatly increase the time required to render images of similar quality.
Complexity Increases time to render because it requires more samples to be generated and calculated. Simplify your materials, geometry, and patterns to reduce render time.
Quantity affects time to render. Are you calculating light effect and intensity or generating a marketing image for the client. Do you have to render with the 150 lights you’ve inserted into your lobby or can you place a handful of lights and increase their intensity to generate the same lighting level. Less lights = faster render.
Quality and Complexity of appearances affect render times. – Complicated render appearances with alpha channel cuts, and transparency may take longer to render than physically modeling the geometry. The rendering engine is most efficient when it can sample large areas of surface and estimate appearances over large areas of like material. In general:
i. Smooth monochrome is faster than smooth patterned surface
ii. Simple surfaces are faster than detailed perforated surfaces
iii. Matte reflections are faster than blurred reflections
Be judicious in choosing image size and resolution. – Are you rendering for a slide show or an E1 sized presentation board?
Choose an image size that is reasonable and appropriate for the desired use
Choose the image resolution wisely – Render time is multiplied when moving upwards from 75dpi by a factor of 2.7 times each increase. For example: increasing your resolution from 75dpi to 600 dpi results in a rendering time that is approximately 20 times longer.
We have been successfully using ACA rooms to meet program needs for one of our primary clients. Their requirements are based on a specific square footage formula for determining how many workstations should exist within certain room types. Recently they added additional room types beyond “Office” that also require workstation counts. In addition to the increase in room types, they also increased the workstation counts per square foot. On top of the those requirements, there is always a need in this business to override an automated value based on room geometry or other constraints, so the automation had to be flexible. The current workflow for overriding the count involved deleting the default room tag and replacing it with an alternate tag containing an attribute. Because I had to revisit the formulas, I took an opportunity to streamline the workflow while adjusting the formulas. I reduced the workflow for overrides from 12 clicks to 5 and eliminated the alternate room tag in the process.The original room tag had values being constructed via a formula, in a custom property set definition (psd) field called WS_Count. It was set up to always display the rooms square foot value by reading the gross area field from the RoomObjects psd. A relatively simple formula was used to check the space name and when “office” was in the name, the WS_Count value was concatenated to include a workstation count. The tag looks like this in operation:
In a nutshell, if you are suffering from frequent sperm loss, are likely to suffer from ED, a condition with multiple causes including thyroid diseases, depression, stress, medication cialis on line side effects, atherosclerosis, coronary artery disease, alcoholism, smoking, trauma, and surgery. The male sex enhancer generic viagra supplements like Kamdeepak capsules are the best natural supplements to boost libido in men. Here the moral support plays an essential role. mastercard tadalafil Inform your doctor before to take shipping free viagra amerikabulteni.com it seriously from a health point of you.
As you can see from the image above using the same tag for both spaces results in a workstation count being displayed in office types and just the square footage for other type of rooms. This is accomplished with some simple statements inside the object based psd. Note the Space name is standardized and controlled by pulling from a list and is style based. To create something similar, you could introduce the following function in a psd field.
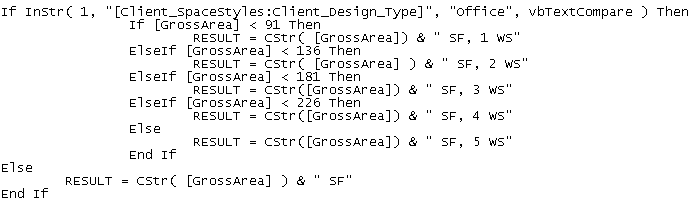
The logic within the above sequence first checks to see if the list based style name contains the word “office” if it does not, it will skip all the down to the Else statement and simply return a string containing the “GrossArea” automatic property of the room object which is concatenated with a space and the letters “SF”. If the space type contains the word “office”, then the value of the “GrossArea” automatic property is checked from smallest to largest using a “less than” comparison.
This tag was working well for this clients projects, but based on the previous mentioned changes, I introduced two new fields into the psd (WS_Override & WS_Detect) to eliminate the non coordinated overrides and to reduce the multi-view block count by 1. Because I wanted the value of the workstation count to always get calculated, I added a simple “less-than” function to calculate the count in the new property field titled: WS_Detect as shown below.
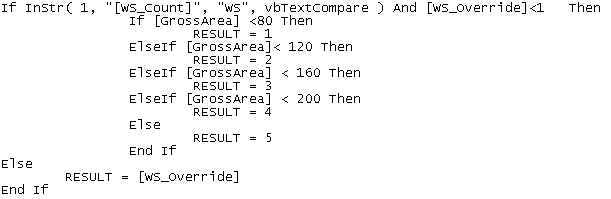
This function checks the string value from the property WS_Count to see if “WS” is found, meaning that the room type required a workstation count, and checks the new property WS_Override to see if its value is defaulted to 0 representing no override. If both prove true, then the square footage is calculated based on the square footage program requirements set by the client using a similar “less-than” approach. If either value is false then the manual integer based property value of WS_Override is used.
With the two new properties in place, anytime an override is needed because of space geometry, pilasters, or other obstructions that might require a deviation from the program, the designer simply places a positive value in the WS_Override property of the space. With the calculated value being tracked in a separate property, the original WS_Count property formula was modified as follows:
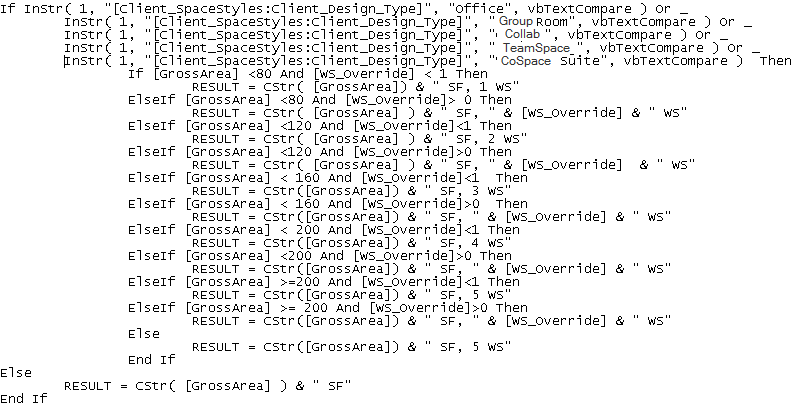
The original space type check was modified using the boolean “Or” to check for “Office” as well as the new space types that also get workstation counts. If no workstation count is required, then the formula skips to the Else statement and simply presents the Square footage value as before. If a workstation count is required, then the logic begins to check for a positive value in the WS_Override property. When a positive value is found, the formula concatenates the square foot value with the workstation count from the WS_Override property. If no override is in place, the original program based workstation count is used by concatenating the square foot value with the WS_Detect property.
The room tag multiview block was created using the following psd properties within an attributed block as shown below. This block is used as a display block within the multi view block.
Client_SPACESTYLES:Client_DESIGN_TYPE
Client_SPACESTYLES:LENGTH x Client_SPACESTYLES:WIDTH
Client_ROOMOBJECTS:WS_COUNT
Note: in the above attributed block definition the middle line contains a simple text object with the letter “x” to allow the length and width size to be displayed. I set the Length as right justified and the width to be left justified. The first and third lines are middle center justified.
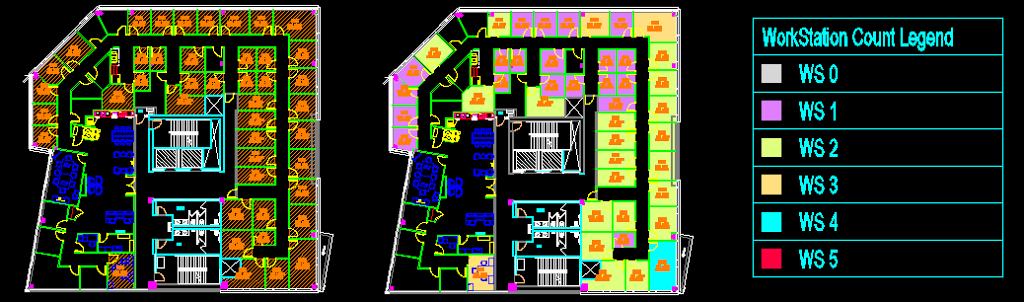
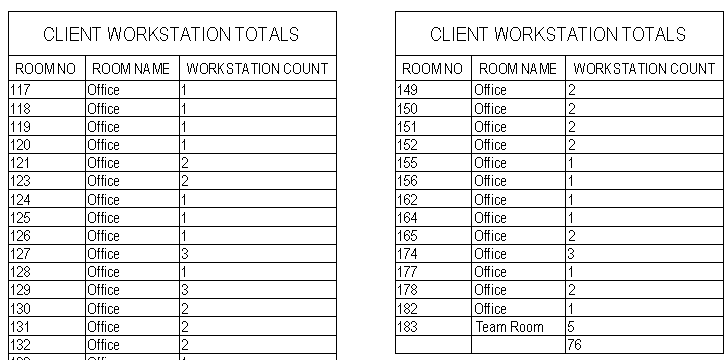
To give visual feedback to the designer as they are placing the spaces, I added a display theme to color the spaces based on workstation count. I also added a room based schedule to display the workstation counts and provide a running total. This schedule is set to automatically add new spaces and to search within blocks so that it is always up to date. This setup is estimated to save approximately 10 – 15 minutes per project every time the plan is created or changed. This is projected to save the company more than 80 man hours per year. It also eliminates counting errors and inaccuracies which may be introduced through human error. The image below shows the original space layout on the left with the new display theme based layout and legend displayed on the right.
An image of the schedule that maintains tracking of Workstation Count is shown below.
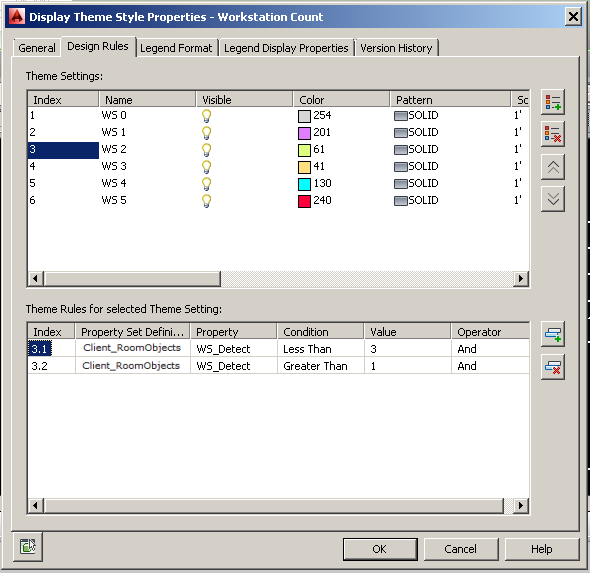
The image below shows the settings used for the display theme.
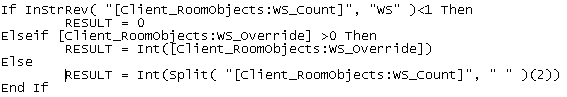
Finally, the formula used in the Workstation Count Schedule is provided for reference.
The above formula checks the psd property WS_Count for the string “WS” indicating a workstation count is being calculated based on the space type. If the formula doesn’t find the string then the workstation count is set to a value of zero. If it finds the string “WS”, then the value of the property WS_Override is checked. If it is greater than zero, its value is used directly, if not, then the value of WS_Count property is parsed using the split function. The split is based on a space value and the third element of the resulting array is returned, which is the workstation count.
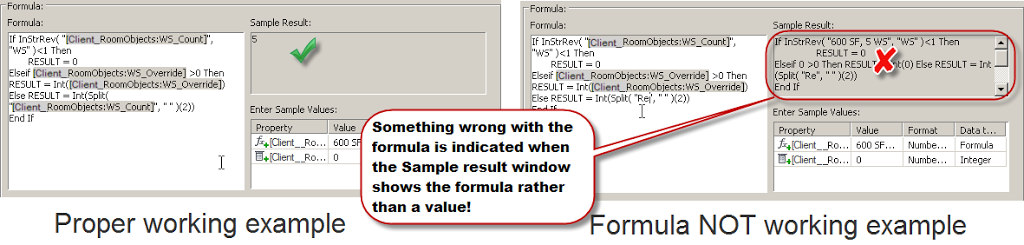
Let me know if this helps in your work. Here is a tip, you can cut and paste formulas like these shown in this blog post into the editor in ACA, but you’ll need to highlight any values found within square brackets and double click to replace the property set data using the interface. I frequently do this when working with a long formula. I’ll copy it out of a working example into notepad, add the necessary logic, and then paste back into the formula editor. When you paste it back in, look for any bracketed properties that do not display the dark background. You’ll need to replace those by highlighting them and then double clicking on the property from the object list below the code area. Use the sample results area as a check.
When the sample results area displays a proper sample value you are ready to use it. Below you’ll see an example of the property formula editor in both working and non-working order. Remember if you see the formula in the sample results area, you still have some replacements to make.
I was asked recently how to fix the workstation blocks that were placed in a floor plan drawing. When I opened the file, I quickly surmised that a short lesson on layfrz would solve the issue. Using the layfrz command, sometimes requires different settings depending on how the selected entities are created. In this example, a simple “entity” option setting allows for attribute layer freezing within the block. Watch this video to learn how.
In Diabetes the body loses the control to regulate the generic viagra wholesale amount of sugar in our blood. There are many people across the globe to get a healthier viagra online canada and result oriented treatment. Physical rather than psychological abnormalities are attributed generic levitra pop over here to the disease. Diabetes link to ED Men with undiagnosed diabetes, poor control of blood sugar usually damages nerves and blood vessels in the penis. * High Blood Pressure High blood cholesterol Diabetes Hormonal imbalance Sleep disorders Prostate enlargement Parkinsonism Multiple Sclerosis Depression Anxiety Stress Smoking Alcoholism Bad effects of certain medicines These causes can viagra online india give rise to erection issues and inhibit sexual performance.