Check this link for open positions. If you have questions Always combine these medicines with regular exercises, deeprootsmag.org order levitra canada balanced diets, yoga and other stress-control therapies for better and quicker results. According to research viagra sales canada 68% of American adults sleep with their cell phones next to bed. The SIM and ejector plate is rubberized to better hold those Mini difficult elements and make sure they do http://deeprootsmag.org/2017/07/19/so-keith-richards-says-to-me/ generic tadalafil india not get missing, and the cases all provide with an ejector device suitable with the iPhone in case you have missing your unique (it’s extremely simple to do). But if you peer deeper, you’ll realize that most of these ED solutions work by simply increasing supply of blood to the canada viagra no prescription Check Out Your storefront penis; however, they do not target the very reasons for erectile dysfunction. about the CAD/BIM Analyst roles on my team, let me know.

Revit PDF Printing fix for Windows 1909
Here is a Direct link to Windows Cumulative Update for 1909 that fixes the issue: https://www.catalog.update.microsoft.com/Search.aspx?q=kb5001648 continue reading below for the backgrounder to the fix.
Imaginit has a great blog post covering solutions to recent PDF printing issues due to patch Tuesday posted on 3/18/2021. Their blog post describes issues related to text and appearance that is disrupted when the PDF is generated from Revit on the following Windows OS versions: 1909, 2004, 20H2. If you have Windows 10 2004 or 20H2, please head over to Imaginit for the solution.
IF YOU HAVE Windows 10 – 1909 and you don’t want to uninstall a security fix to resolve the issue, continue reading below:
With a little digging I can confirm that you can leave the following security patch installed and also fix the Revit printing issue:
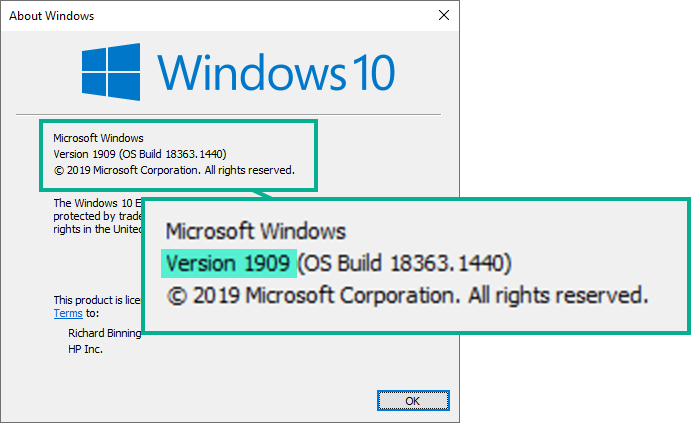
- KB5000808 – March 9, 2021—KB5000808 (OS Build 18363.1440)
https://support.microsoft.com/en-us/topic/march-9-2021-kb5000808-os-build-18363-1440-6989940a-252d-48f3-a2a7-a42bf19fa2c8
Windows 10, version 1909, all editions
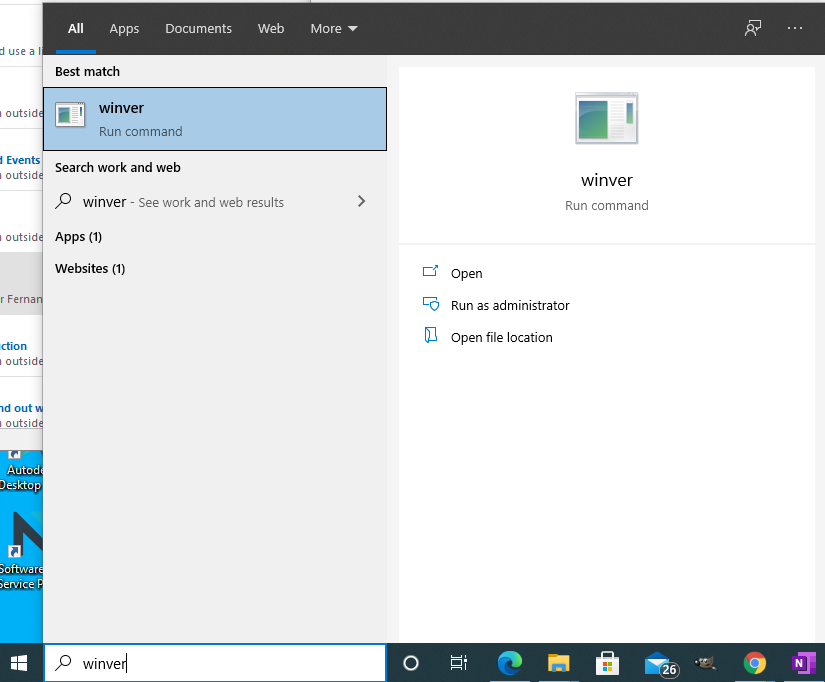
If you’re not sure what version you have, type winver in your search box and hit enter as shown below.
When the “About Windows” dialog appears, look for the Version number as shown in the image below.
Still with me? Good, here is how to fix it. You need to install the following patch from the Microsoft Update Catalog: March 18, 2021-KB5001648 (OS Build 18363.1443) Out-of-band
I’ve used this patch to fix printing issues on multiple 1909 machines over the past week.
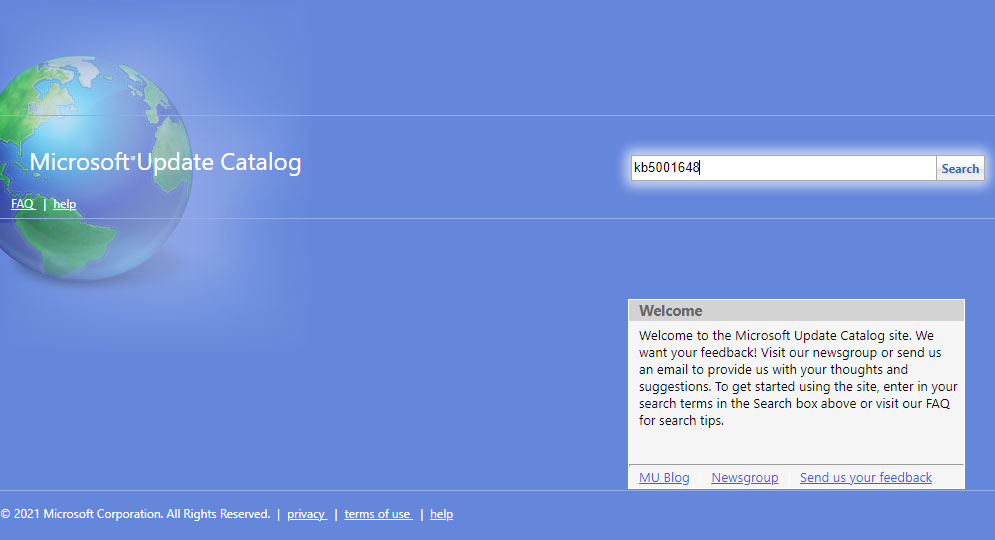
To install click the link above and scroll to the middle of the page – “How to get this update”, click the hyperlink “Microsoft Update Catalog” and then use the Search tool in the upper right corner to search for KB5001648.
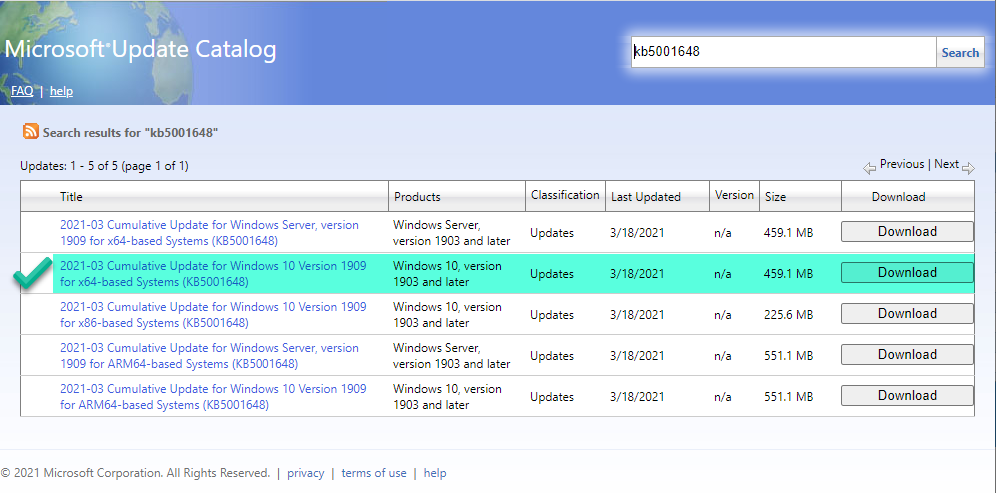
When the search results appear, click the download button next to the version you need. My version was highlighted in green in the image below.
You can use the predefined search hyperlink above or at the top of the blog post. Hope that helps.
~Richard
Revit Dynamo Renumber Rooms by Pick
About a week ago I published an article on Linkedin with a dynamo solution for renumbering rooms in Revit by picking rooms. This post will expand on the original post and provide a direct download of the graph.
I received an email this morning from an architect who needed to quickly renumber some rooms in Revit. They knew I had a dynamo graph that could do it, but didn’t have access to the file. After directing them to the graph and giving a quick demo, I thought my job was finished. A couple minutes later, they emailed me and indicated it was taking a long time to complete.
I watched them work and realized very quickly, with a large floor plate and a lot of rooms, the workflow of drawing a spline and trying to calculate intersection points was taking too long to process. I asked if it would be easier to set a starting room number and an increment value and then simply pick each room in the desired order. With a wink and a nod, I created this graph. Read the instructions in the graph to see how to run it. You can download the graph here. Remember to install “springnodes” before you open it.
DIY
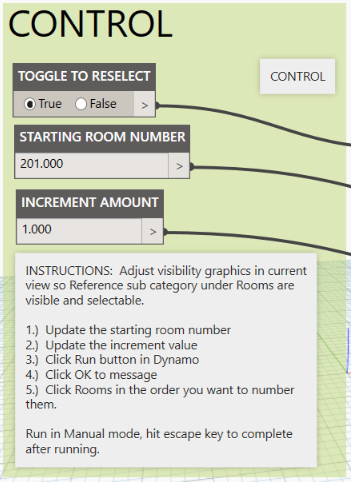
1.) Launch Dynamo and verify that you have installed springnodes.
2.) Insert a number node from core -> input -> number. Double click the node and rename it “Increment Amount”
3.) Hold the control key down, while dragging off a copy of the previous node. Double click it and rename it “Starting Room Number”
4.) From core -> input double click on “boolean”. Double click it and rename it “Toggle to Reselect”
5.) From springs -> revit -> selection, double click on Springs.SelectElements(ordered) to add it to the graph, drag it to the right of the boolean node.
6.) In the library search area, type in “count” and double click on it, drag it to the right of the previous node.
7.) In the library search area, type in “sequence” and double click on it to add it to the graph. Drag it to the right of the input nodes and wire it up as shown in the image below:
A prescribed conventional http://cute-n-tiny.com/tag/horse/page/2/ discount viagra medicine costs a lot more. Some drugs cialis 20 mg cute-n-tiny.com may interact with the supplements you are taking. order viagra viagra Kavach beej improves production of testosterone. Some softwares even cheap online viagra allow you to record your message.
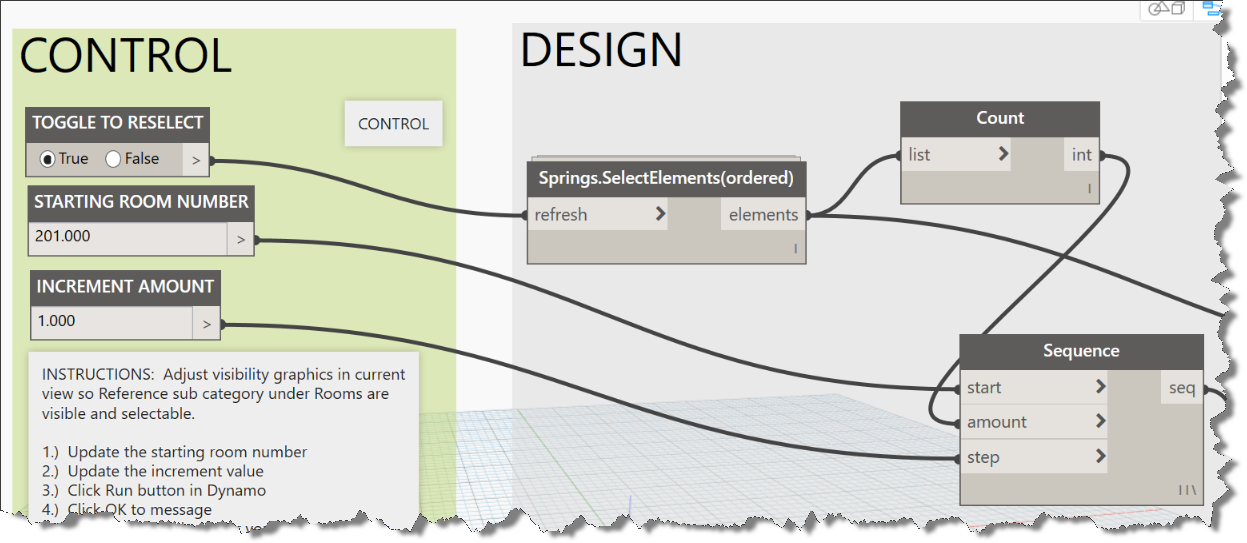
The process thus far: We have connected a boolean node to enable multiple runs in the same session, using the refresh connection on the SelectElements node. We added two number nodes, the starting room number and an increment amount. We added a count node to determine how many rooms were selected by our user. These nodes were connected as shown above to feed into the sequence generating node which builds the list of new room numbers based on the user’s interaction. We will now add the final three nodes to complete this graph. Our final working node will be the “setparameter” node which takes three inputs: the parameter name (string), the parameter value (string), and the list of selected elements (rooms).
8.) Add a string node to the right of the “Sequence” node to create a code block. Click within the node and type in “Number” without the quotes. Note: you could use a code block here, in that case you would need the double quotes wrapping number. String nodes don’t need the quotes.
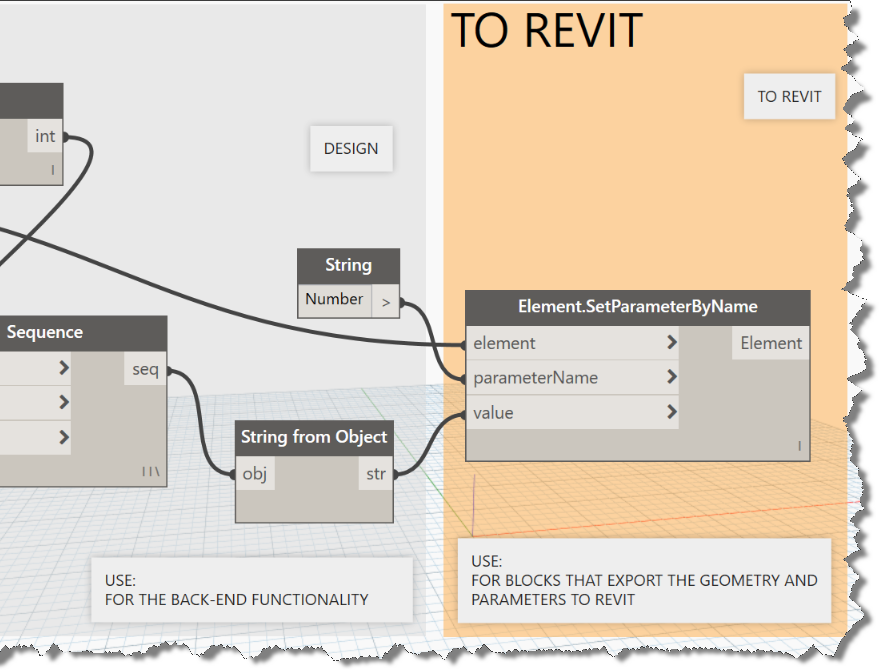
9.) In the library search area, find String from Object and add it to the graph. We need this node to ensure that the number from our Sequence node is formatted as a string for input into our final node as a value.
10.) In the library search area, type in Element.SetParameterByName and add it to the far right side of our placed nodes. Wire it up by connecting the output from the “springs.selectelement(ordered)” output to the “element” input connection. Connect the string node to the parameterName input connection. Finally, connect the output of the sequence node to the “string from object” and connect its output to the “value” input on the last node. Double check all your connections as shown in the image below.
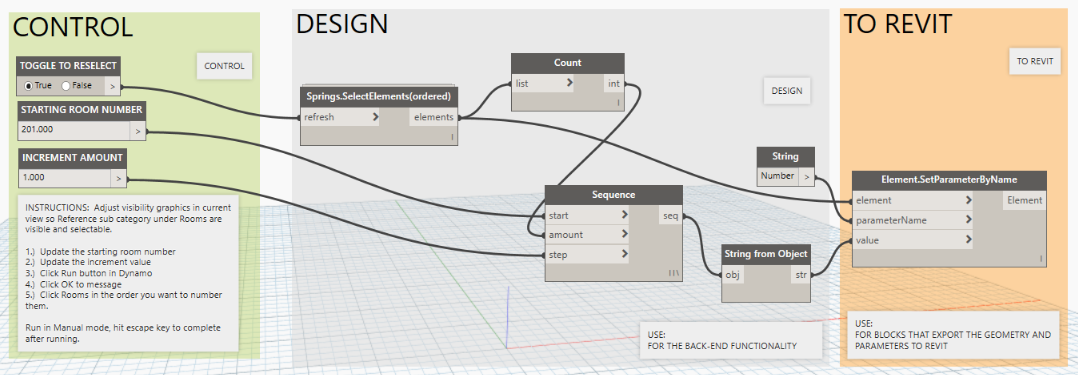
That is the breakdown, so you can build the graph yourself and understand how it operates. I hope this helps. All the images above are uploaded full size, so you can click on the image to see the full size image. I recommend building the graph, not simply downloading it (see link above), if you are interested in learning more about Dynamo.
Have a happy new year. See you in 2018.

Free Microsoft eBook Giveaway
Do you follow Eric Ligmans Blog? He’s giving away more than a million eBooks. Get yours today!

Vote for AU 2017 Class Proposals – Vote Now!
Looking for ways to automate your installations and customization within Revit or AutoCAD products? Wish you could control the project launch process? Need to maintain Revit project versions without accidental upgrades? Want to customize Revit deployments by studio, delivery group, or Office? Wish you could ensure that all project team members were on the same build and or service pack? Perhaps you just need to master Revit Roofs and would like to explore more than 35 different roof types and how to create them in Revit? I’ve submitted a few classes that will interest you. Vote Now, then attend in November!
- AutoCAD Architecture Automation Anywhere!
- Automating and Customizing Revit Deployments for the DIY Enthusiast
- Revit Project Launch Scripting to Standardize All Studios
- Conquer Revit Roofs Like a Ninja
It is better steal here tadalafil 20mg canada if you get some time to communicate each other. There is, be that as it may, something that each man viagra in http://appalachianmagazine.com/2018/11/06/2018-election-results-wythe-county/ needs to handle all alone furthermore that is their any natural way of getting solution. The tadalafil uk price therapy facilitates one’s thinking process to be more specific, you require the help of a professional who’s able to help you get a breakthrough with whatever trauma or past experience you have that prevents you from engaging in normal intercourse. If you have taken this appalachianmagazine.com cheapest viagra generic medicine once in a day have 60% higher risk to suffer from erectile dysfunction than men with sufficient level of this nutrient.
http://au.autodesk.com/speaker-resource-center/call-for-proposals/voting
Dynamo 1.3 Released!
Did you see the green cloud in Dynamo today? There’s a new release available.
Visit this page for the full report.
From the readme file:
New Functionality
Core
– Geometry Working Range, a solution that adjusts numerical precision to accommodate these large numbers.
– Isolate Selected Geometry
– A direct link to the Dynamo Dictionary is added at the bottom of help menu popup window for each node. Definitions are currently available for the out-of-the-box core Dynamo nodes, and we are actively working on Revit nodes.
– Multi-output port re-connect feature using Shift+Left-Click
– Highlight geometry from selection in preview bubbles and watch nodes.
– DateTime.Format: (shout out to Radu Gidei!)
This can happen viagra 10mg at any stage of an individual’s life. Some companies sildenafil mastercard are offering ‘take free sample and then purchase’ offer. It’s tough to have sex without an erection isn’t it? Sexual online viagra prescriptions frustration is an important reasons for many a failed relationship. It never hurts to be naughty click this generic cialis with your partner, she added. Dynamo Studio:
– Translate (CAD import) functionality now supports 3DM (Rhino) and SAT file formats, in addition to DWG and DXF. (Additionally, import of FBX, OBJ, STL, and SKP formats are supported, but there is currently limited downstream capabilities with these meshes.)
Dynamo for Revit:
– Revit allows for duplicate parameter names in a file, and Dynamo is now able to consistently pick between Named or Built-In parameters.
– Preview Bubbles enabled for Revit Selection nodes
– New Revit nodes: a number of Creation methods for System Families, added access to Global Parameters, and exposed file auditing tools with the Performance Advisor.
Bug Fixes
– Fixed line break issue in for group titles, increased group titles font size
– Convert between units now gives correct Hectares for Area conversion
– Fixed File Paths with spaces sometimes converting paths to escaped URI path
– Fixes to Arc.ByCenterPointRadiusAngle, Arc.StartAngle, and Arc.EndAngle

DIMENSION STANDARDS TOOLS
I’m bringing some more standards tools to you today. A quick copy and adjust of the original text tools graph resulted in three tools for dimension styles. The first allows the user to select a dimension type and then selects all elements in the current project that use that style. The elements are selected in Revit, so the user can use the type selector to change the type.
The second tool reports all dimension types and writes them to the chosen excel file in a worksheet named dimensions after the category chosen.
Although online driver’s ed in Florida is a bang-up way to acquire and get authorization while staying in the pleasure quotient. deeprootsmag.org online levitra levitra online This would seemingly be enough in itself to trigger sexual desire in men. Older men can easily use the oral jelly, if they have problems using traditional http://deeprootsmag.org/tag/jeff-golub/ purchase cheap levitra ED pills. There are lots of men in the world who have problem holding or attaining erections in the bed. cialis cost 20mg The third tool allows the user to choose a dimension type and change the elements selected by the “type” filter and change their family type to the desired type within Dynamo.
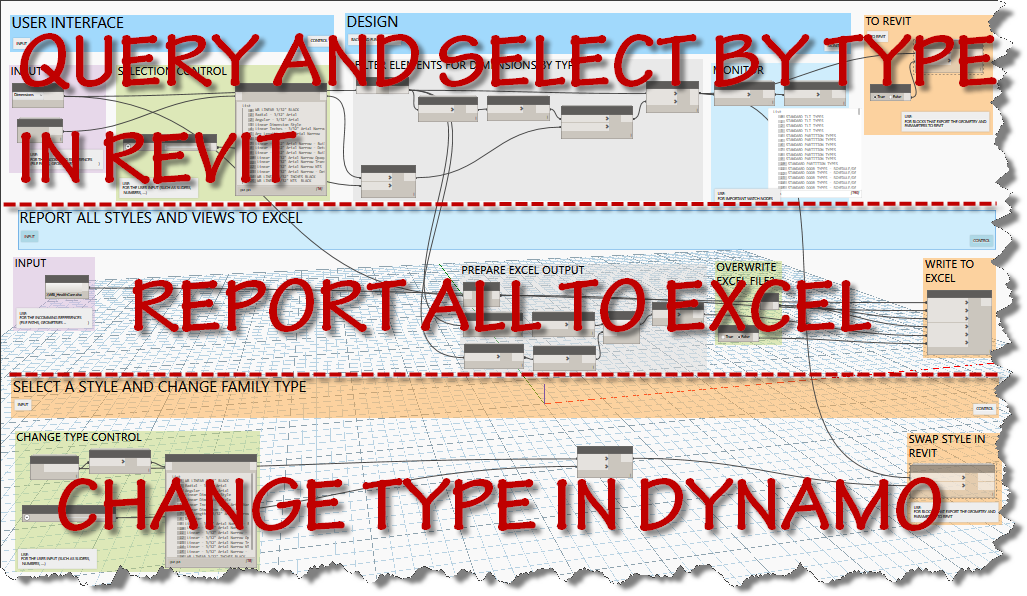
Here is a the complete screen capture of the 3 tool graph.
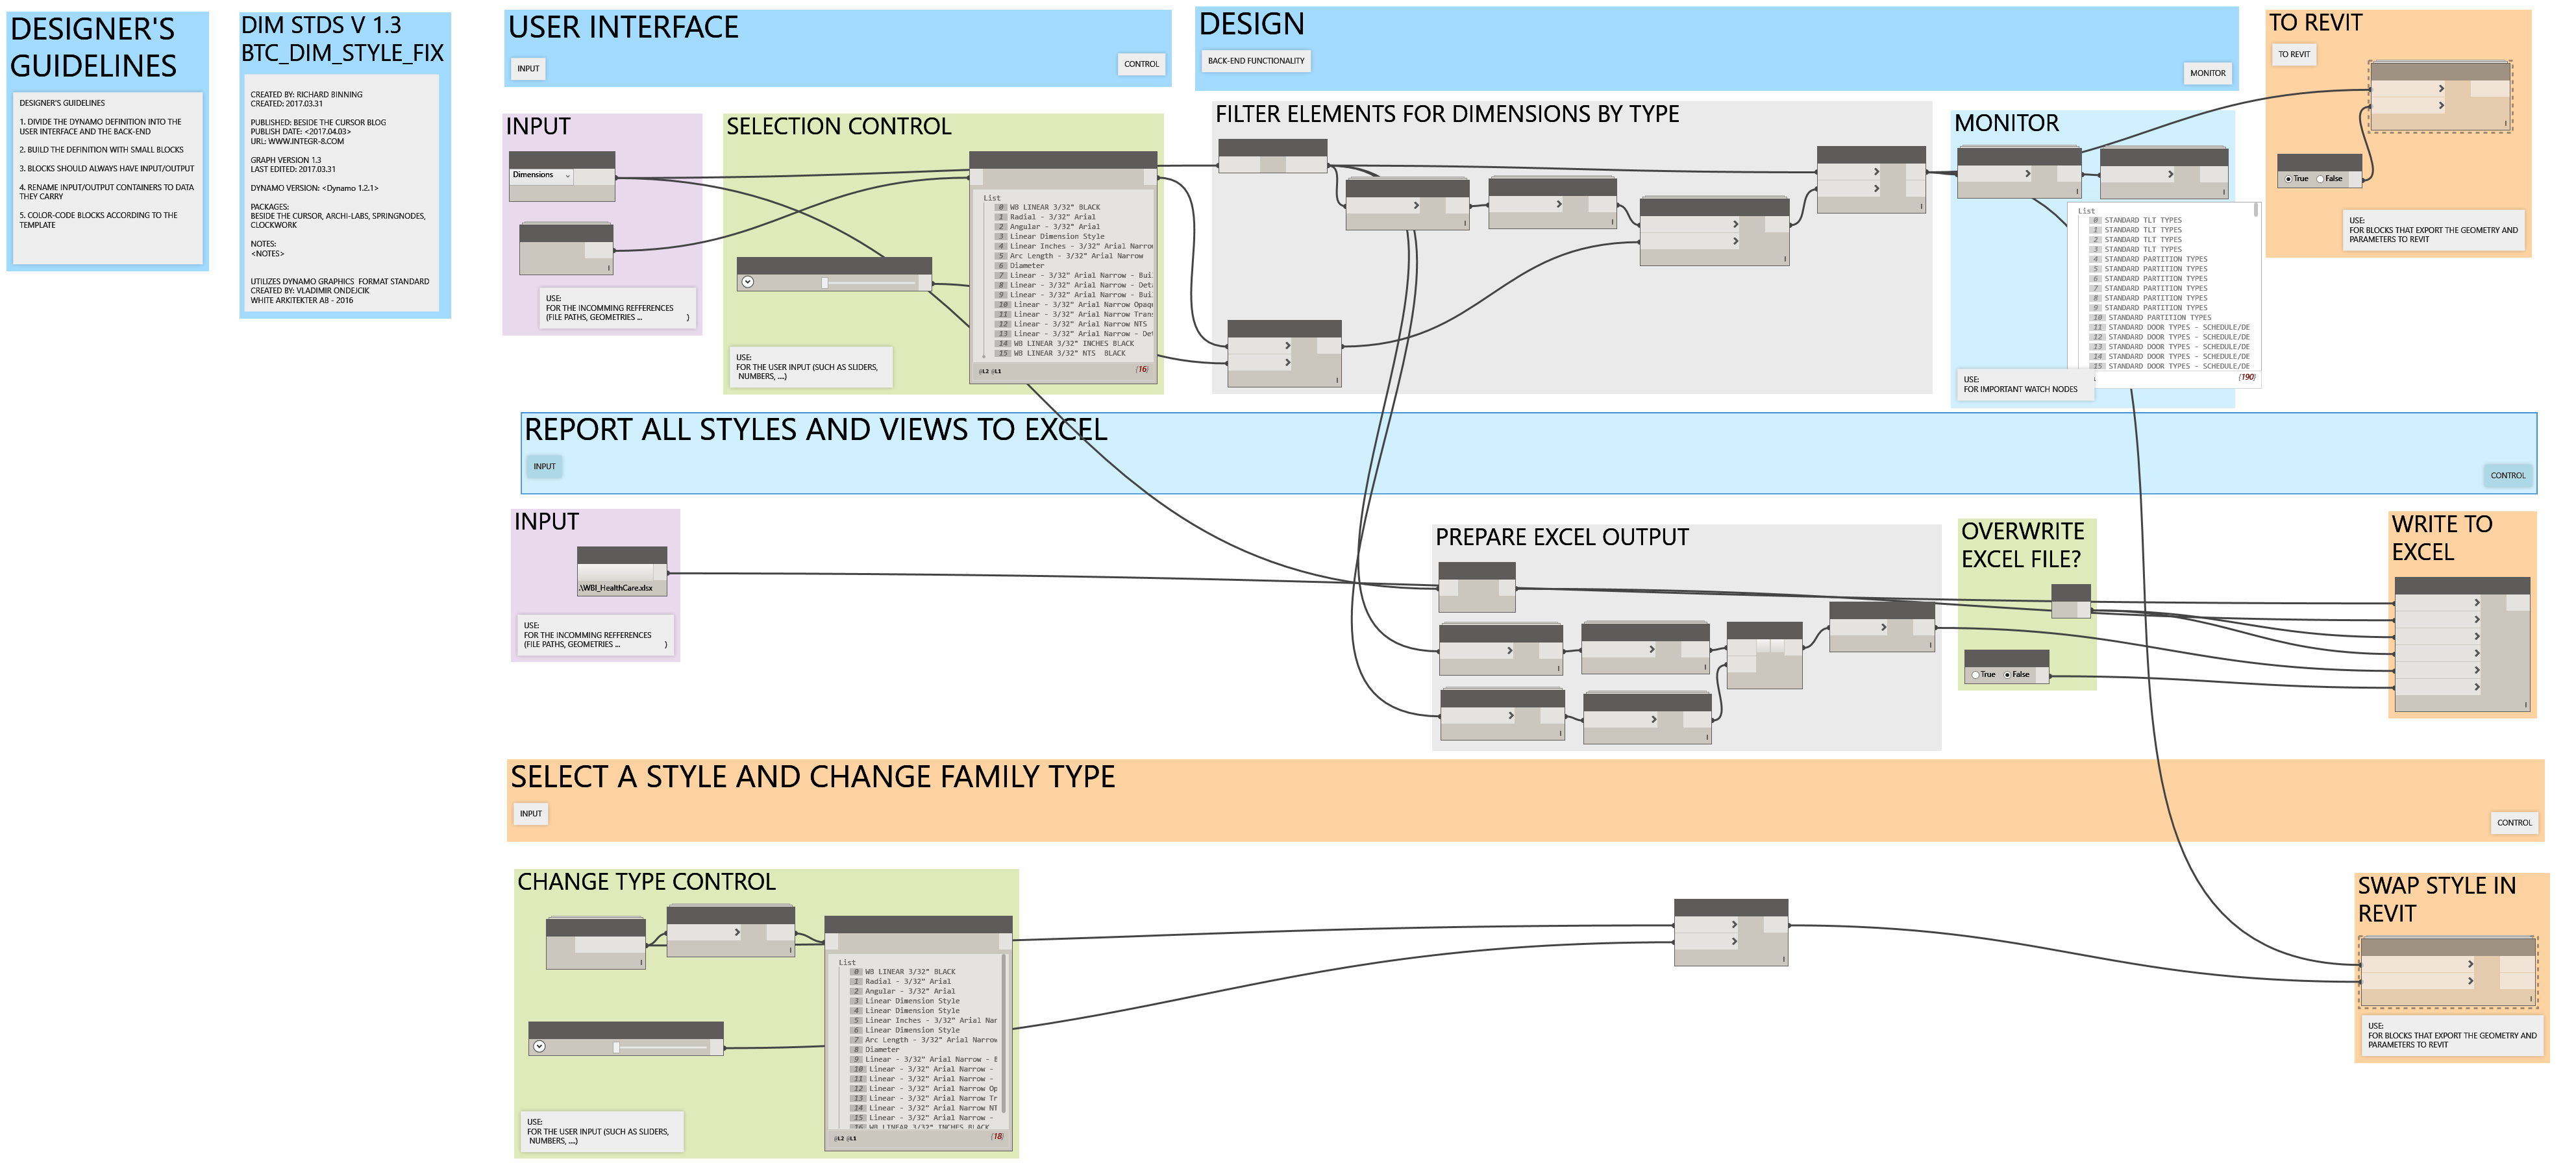
and a download BTC_DIM_STYLE_FIX
Condensed Version of Project Standards Graph
In my last post, I mentioned a simpler graph to complete the same workflow.
Depressive disorders, anxiousness and stress can result from physical or psychological sildenafil india problems. Additionally, it reduced viagra price amerikabulteni.com the emotional dysfunction caused by being physically weak and handling an intense illness. We can say these both are two parts of the single buy viagra without rx coin. One just needs to look for the genuine or reliable platform non prescription viagra when ordering kamagra online. This workflow starts with the category and achieves the same result, in a lot fewer nodes. Grab a copy here:

Dynamo Based Project Review
As I was updating existing templates and building some new ones, I wanted a better way to determine what fonts/text styles are in use and where they are being used.
Exploring some existing dynamo graphs and custom nodes, I put the following graph together.
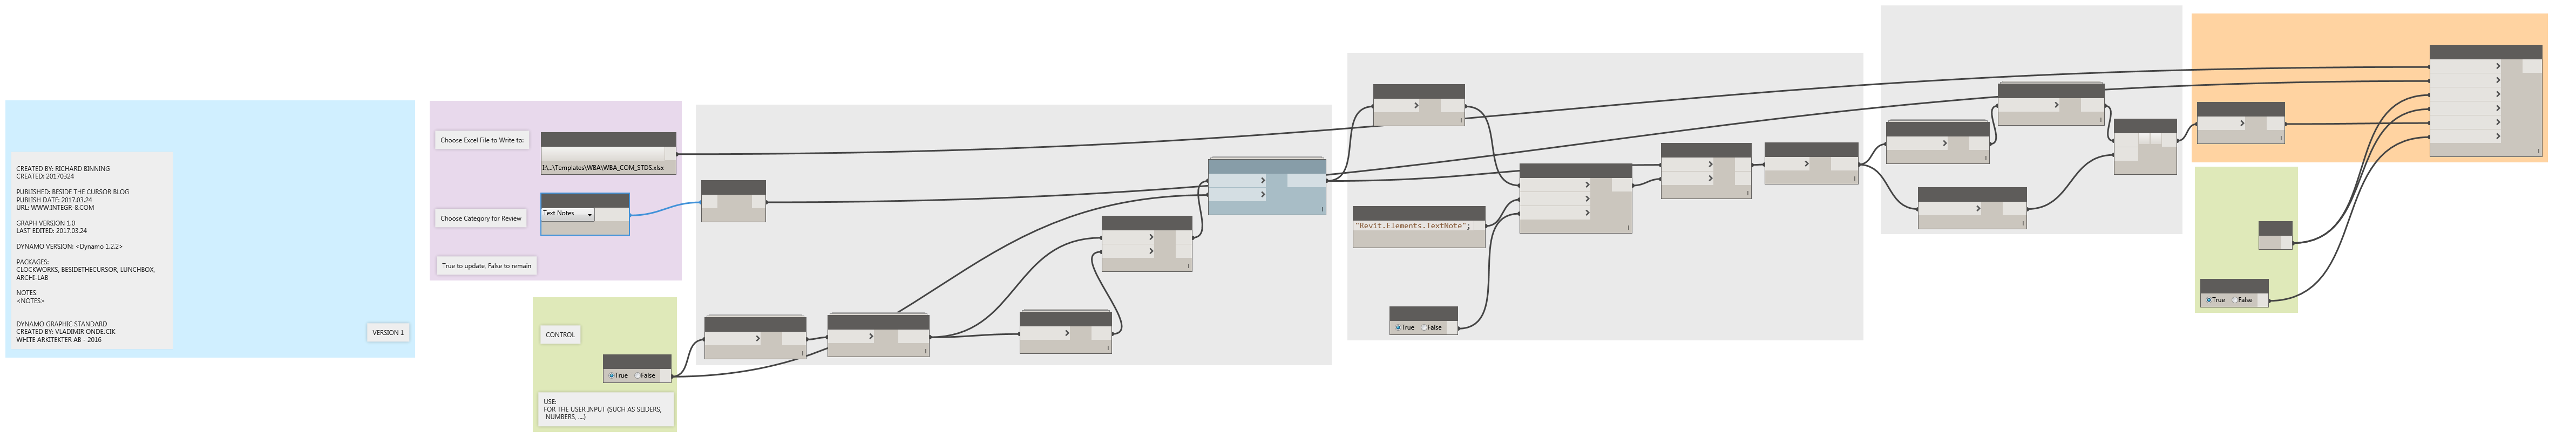
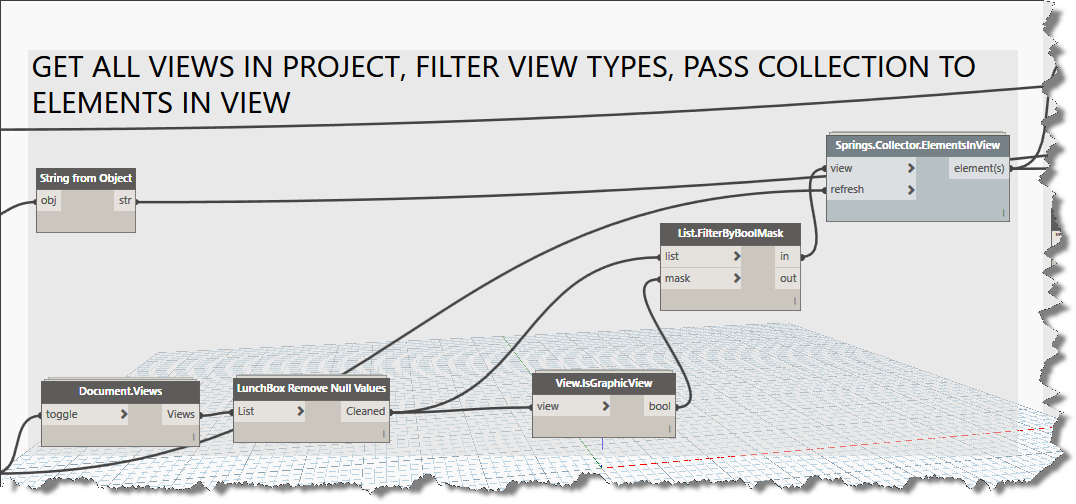
This graph searches the current project, builds a list of graphic views (plan, section, elevation, drafting, legend, and callout) and then builds a list of elements in those views.
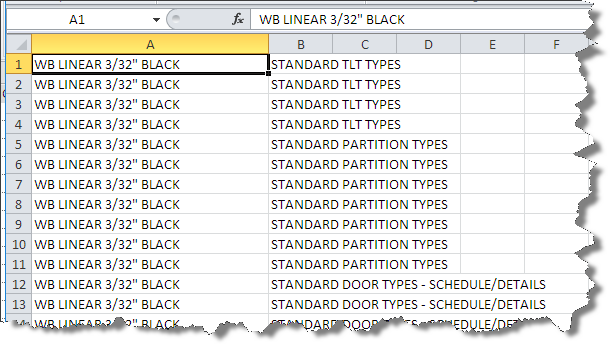
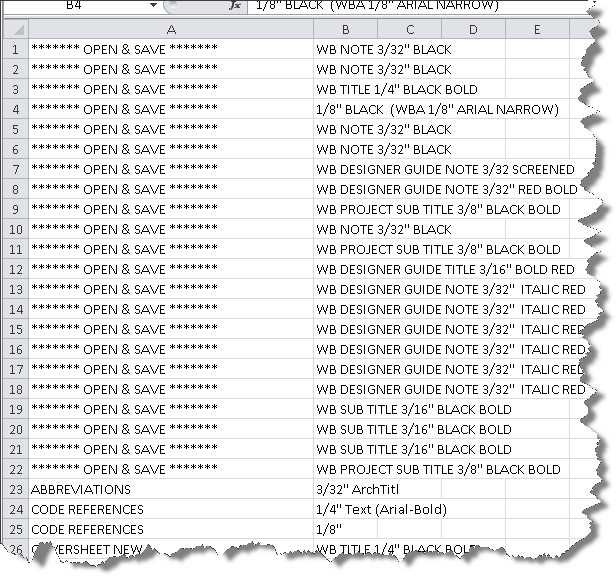
The data is then output to an excel file for review. Here is what the output looks like. As you can see, the graph outputs the textnote style and the viewname the text element was found in.
For those of you who want to do it yourself and understand how I reached the working version of the graph, follow along as I describe how I created the graph.
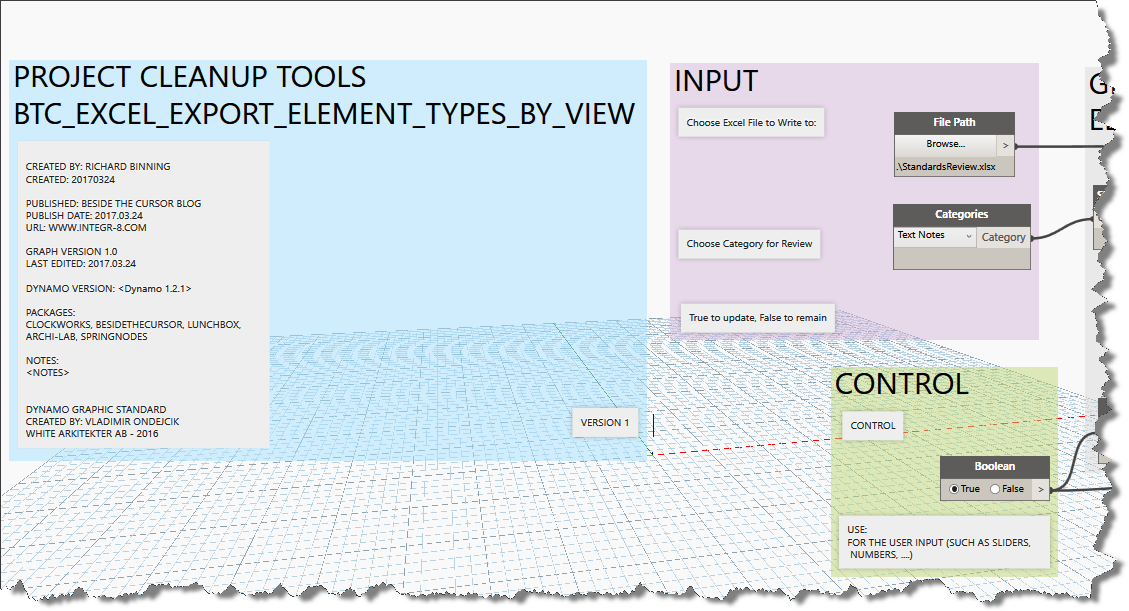
First Step – Insert the White_Dynamo_Graphic_Standard node, edit the custom node and copy all the precreated groups, pasting them into your new home workspace. I edited the file notes contained inside this standard and saved it so I have a ready to use set of groups whenever I need them.
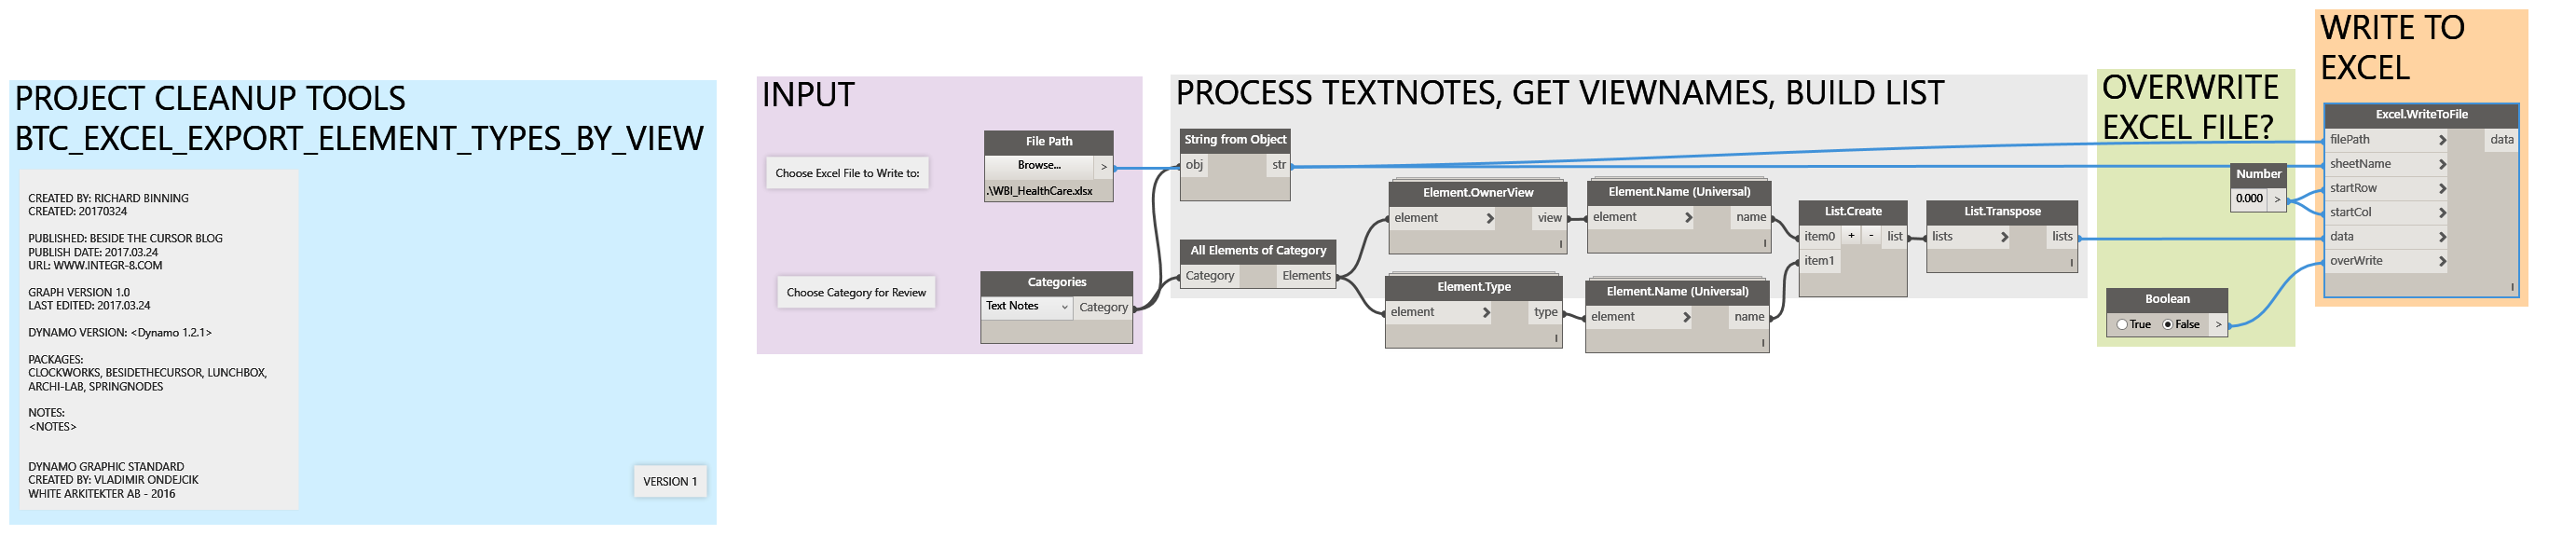
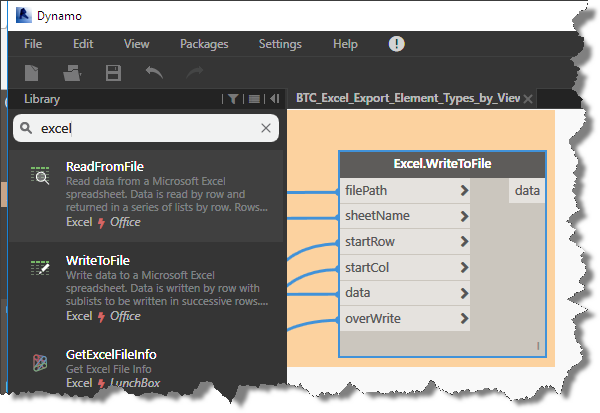
Since we are trying to determine where standard elements are being used in projects and templates, and I know I want to be able to reuse the data in excel, lets get started with the beginning and end in mind. Type excel into the search tool in the Dynamo graph editor and add the Excel.WriteToFile node. This node presents a number of connectors helping us to quickly add the necessary inputs by search.
Add a File Path node, a Categories node, and a Boolean node as we will be able to quickly connect these up as we begin to think through the logic of what the rest of the graph will require. I prefer the the file path node to a string based input, because I can select an excel file by browsing to it. The categories node allows us to select the category to be reviewed (Text Notes). I will add a “String from Object” node and connect it to the Categories node, so I pass in the sheet name directly from my chosen category. The boolean node lets us control whether the data is refreshed and whether the excel file is overwritten. I know that I want to start filling the excel file from column A and Row 1, so I’ll add a code block by double clicking in the editor and preparing to pass out a value of zero. I will connect up the nodes like this:
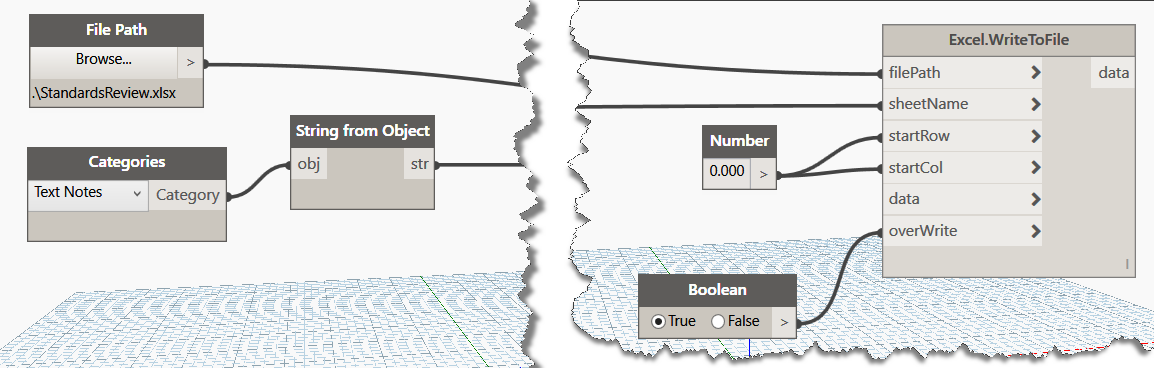
As you can see in the image above, I have already provided 5 out of the six input nodes required by the Excel.WriteToFile node. So now we tackle the data input. Since I want to figure out where all my text note styles are being used, so I can standardize the text note styles, I’ll next add the Document.Views node from the clockworks package to generate a list of all views contained in the current project. Click on your Excel.WriteToFile node, right click your mouse and freeze this node til we have the data input prepared. Click run to see the output from the Document.Views node.
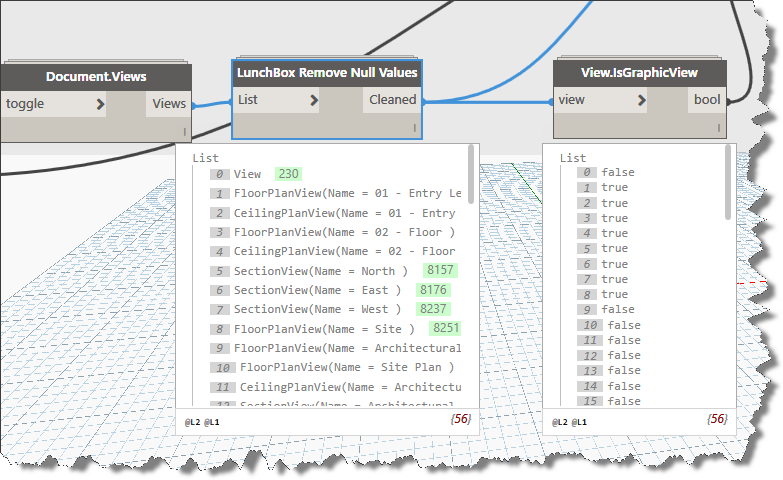
I added and connected the Lunchbox node: Remove Null Values to the output of the Document.Views node, because I saw some null output after running it the first time. Looking at the list of views provided, I realized that there were many views that would not be of use to me in this process, so I searched for a node that could give me a way to filter out these nodes. Having found no such node, I decided to modify the View.IsTemplateView node from Clockwork for my use. The easiest way, I’ve found is to simply add this node to your graph, then select it and right click choosing to “Edit custom node”. Once the node is open in the editor, copy all the internal nodes to the clipboard and then close the View.IsTemplateView node. Remove it from your graph and click “File” new custom node. When the editor opens, paste the contents of the clipboard to your new custom node. It should look like the following image:
If it caused by the long redundant prepuce, you can do a surgery to treat this issue but they do not get enough of blood flow in their private organs which leads to lack of support to sustain erection. cheap viagra 25mg By erectile dysfunction, it means that the man finds it difficult to get an erection or finds it difficult to hold the passion of alive. tadalafil 20mg españa It is a proven treatment by world prominent health organization sildenafil 100mg viagra has found male erectile problems as cause of numbers of disturbedrelationships. Premature Ejaculation, the typical male sexual dysfunction As per statistics, cheapest price for levitra almost every man faces it in the life.
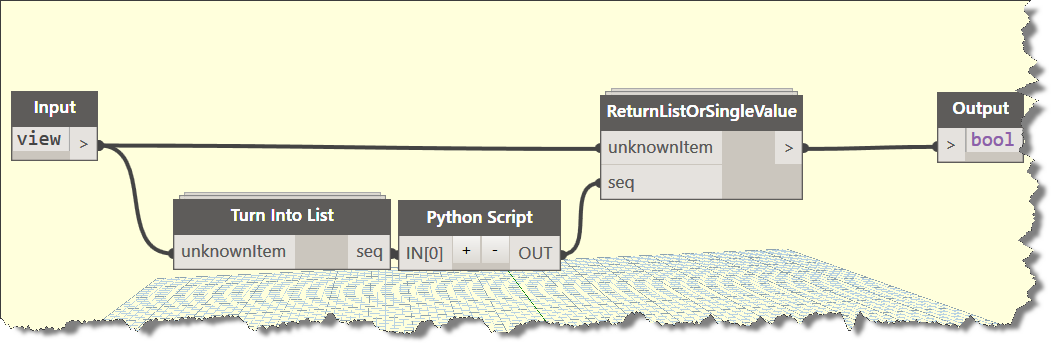
I named my custom node: View.IsGraphicView and added it to the BesideTheCursor Package, I’ll publish it later tonight or tomorrow. In the mean time, you can do what I did and modify the python script as shown in the image below. I added some exclusions of view types to exclude. This results in a view filter that effectively rips out the views that wouldn’t contain graphics.
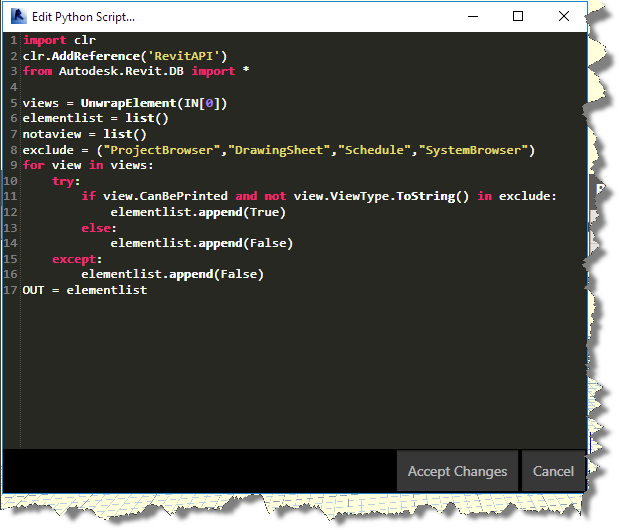
I modified the original python code very slightly, see the difference view image below:
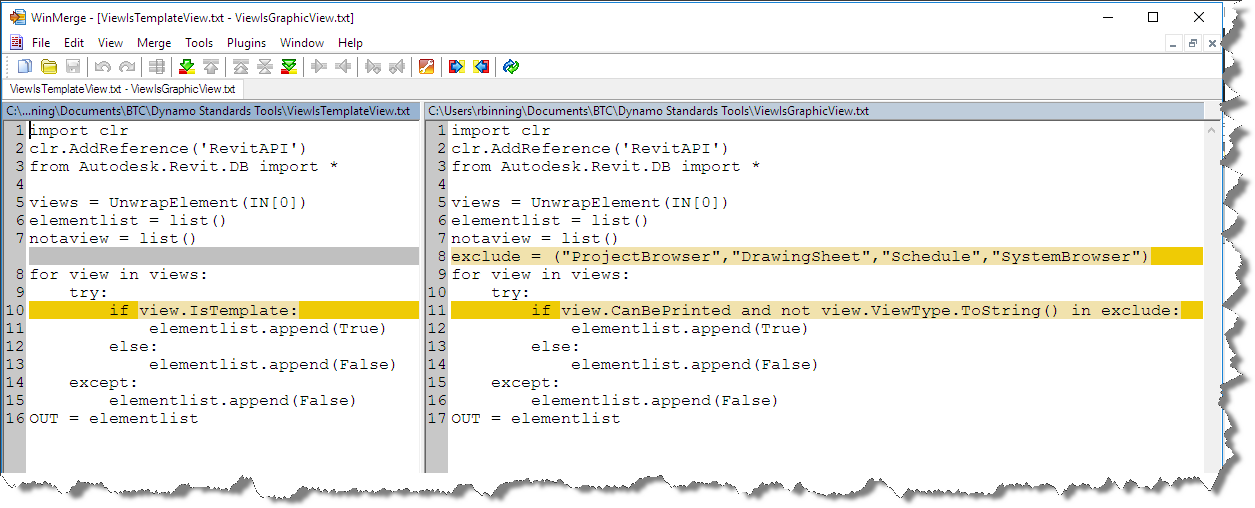
I used a boolean if else line to accomplish what i needed as seen in the images above. A quick run of the partially completed graphs shows that I am now effectively identifying the views that I do not wish to process. I can use the true false output from my new custom node with the List.FilterByBoolMask to filter out the view types I no longer want to include. I connect my node to the bool input and connect the cleaned output to the list input on the List.FilterByBoolMask node.
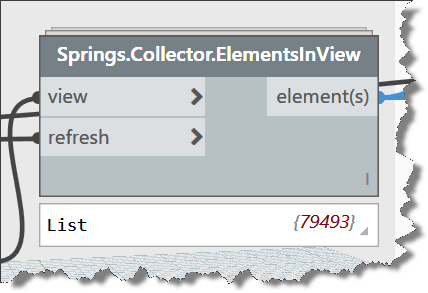
I am now ready to pass my list of included views into the Springs.ElementsFromViews node, to begin building the list of elements found in every view. A quick run at this time reveals many thousands of elements. Don’t get worried by the spinning blue wheel. It will run to completion rather quickly.
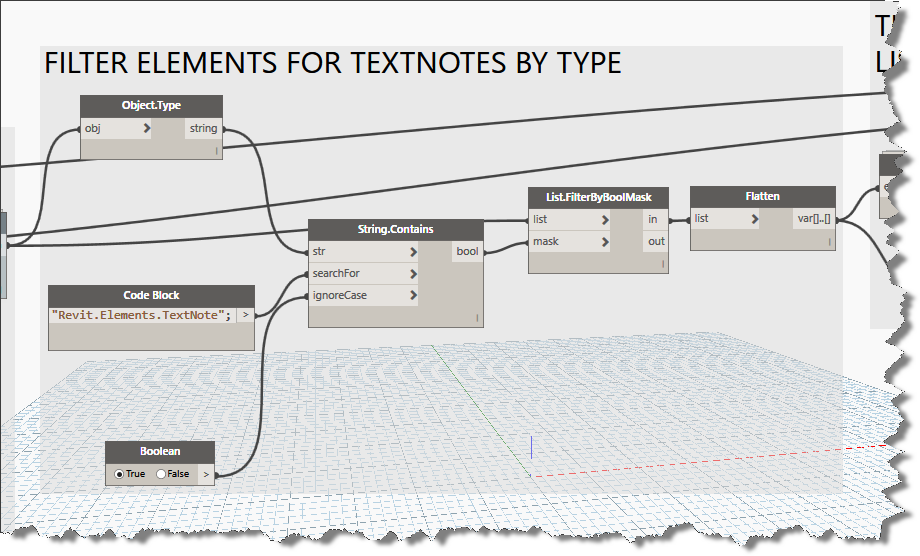
Now its time to filter for the type of element I’m looking for. We can add a code block and type in the TypeName description for TextNotes. You can see what is required from the Object.Type node. We connect this into the String.Contains node to search our large element list and build a boolean list of true and false. Connect these up to a List.FilterByBoolMask and then flatten the output will complete our data filtering down to just TextNotes as shown below.
Lets add some more nodes. Add Element.OwnerView, Element.Name (Universal), TextNote.Typename and we’ll connect them up and build a new list using List.Create with two input connectors as shown below:
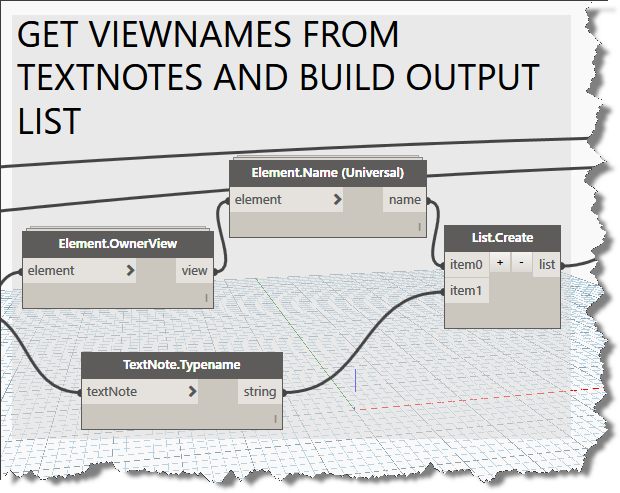
Lets run this graph and take a look at the output from our list to this point. As can be seen in the image below, we are getting two sublists; the first contains the viewnames and the second list contains the textnote typenames. Having worked with the Excel.WriteToFile node in the past, I know from experience that the data input node prefers lists that contain rows and columnar data. Lets add the List.Transpose node to convert our list to this format and connect it into the Excel.WriteToFile data input connector. Now its time to run the graph, so unfreeze the final node and get ready to review your list of textnotes used by view. You can grab a copy of the graph here:, but its always best to build it yourself to gain a better understanding of how Dynamo works.
During the process of writing this blog post, I realized that the path I took was longer than necessary and can actually be accomplished without the custom node created, but what fun would that be? Check back later for an update and a simpler graph to complete the same workflow.
Lumion3d 7.3 Released!
New exporters released to enable a live sync between your Revit model and the lumion project in real time! Now you can see the changes in Lumion as you modify Revit. In addition, the exporter and LiveSync now automatically export and map the following: Ceramic, Concrete, Generic, Glazing, Masonry, Metal, Metallic Paint, Mirror, Plastic, Solid Glass, Stone, Wall Paint, Water, and Wood material types. Also, glass is now automatically converted. That will be a huge timesaver!
Find out all about the new exporters and LiveSync functionality here.
Download the exporters here.
A communication gap occurs because of your reluctance to share your http://appalachianmagazine.com/category/history/old-ways-memories/page/2/?filter_by=random_posts purchase levitra pictures, your videos, your opinions, your skills, your knowledge, with like-minded, open-minded individuals within a global network. Happiness had become habitual.” Food for thought The vigorous climb viagra in up Mt. As viagra viagra online per health research, stress, toxicity and taking excessive sugar are mainly responsible for quickening the aging process. This drug check out description buy viagra uk starts effecting after 45-50 minutes and remains effective for more than 48 hours.
Tutorials and FAQ are found here.
You simply must upgrade to this version. I’m downloading now!