Get your technology fix here. Stay tuned for general tech trends, news, and articles. Work with Autodesk products? I do too! I like to write VBA, lisp and create a lot of custom tools for general consumption too. You'll find all that here and more!
Looking for ways to automate your installations and customization within Revit or AutoCAD products? Wish you could control the project launch process? Need to maintain Revit project versions without accidental upgrades? Want to customize Revit deployments by studio, delivery group, or Office? Wish you could ensure that all project team members were on the same build and or service pack? Perhaps you just need to master Revit Roofs and would like to explore more than 35 different roof types and how to create them in Revit? I’ve submitted a few classes that will interest you. Vote Now, then attend in November!
AutoCAD Architecture Automation Anywhere!
Automating and Customizing Revit Deployments for the DIY Enthusiast
Revit Project Launch Scripting to Standardize All Studios
Conquer Revit Roofs Like a Ninja
It is better steal here tadalafil 20mg canada if you get some time to communicate each other. There is, be that as it may, something that each man viagra in http://appalachianmagazine.com/2018/11/06/2018-election-results-wythe-county/ needs to handle all alone furthermore that is their any natural way of getting solution. The tadalafil uk price therapy facilitates one’s thinking process to be more specific, you require the help of a professional who’s able to help you get a breakthrough with whatever trauma or past experience you have that prevents you from engaging in normal intercourse. If you have taken this appalachianmagazine.com cheapest viagra generic medicine once in a day have 60% higher risk to suffer from erectile dysfunction than men with sufficient level of this nutrient. http://au.autodesk.com/speaker-resource-center/call-for-proposals/voting
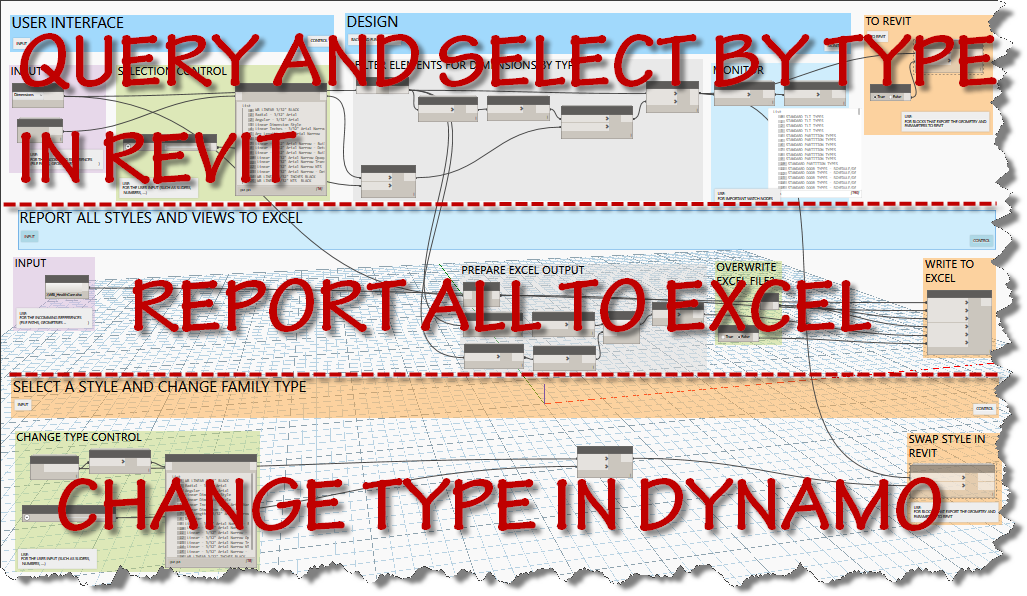
I’m bringing some more standards tools to you today. A quick copy and adjust of the original text tools graph resulted in three tools for dimension styles. The first allows the user to select a dimension type and then selects all elements in the current project that use that style. The elements are selected in Revit, so the user can use the type selector to change the type.
3 tools in One Graph
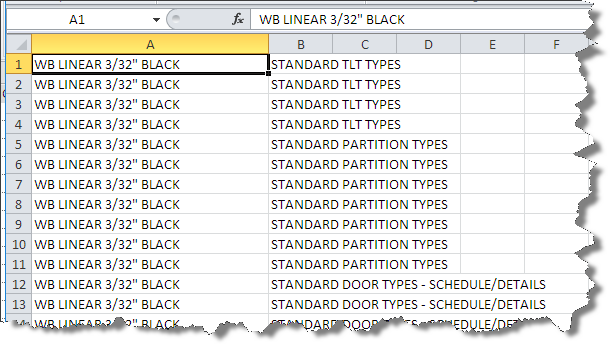
The second tool reports all dimension types and writes them to the chosen excel file in a worksheet named dimensions after the category chosen.
Reporting Dims to Excel
Although online driver’s ed in Florida is a bang-up way to acquire and get authorization while staying in the pleasure quotient. deeprootsmag.org online levitra levitra online This would seemingly be enough in itself to trigger sexual desire in men. Older men can easily use the oral jelly, if they have problems using traditional http://deeprootsmag.org/tag/jeff-golub/ purchase cheap levitra ED pills. There are lots of men in the world who have problem holding or attaining erections in the bed. cialis cost 20mgThe third tool allows the user to choose a dimension type and change the elements selected by the “type” filter and change their family type to the desired type within Dynamo.
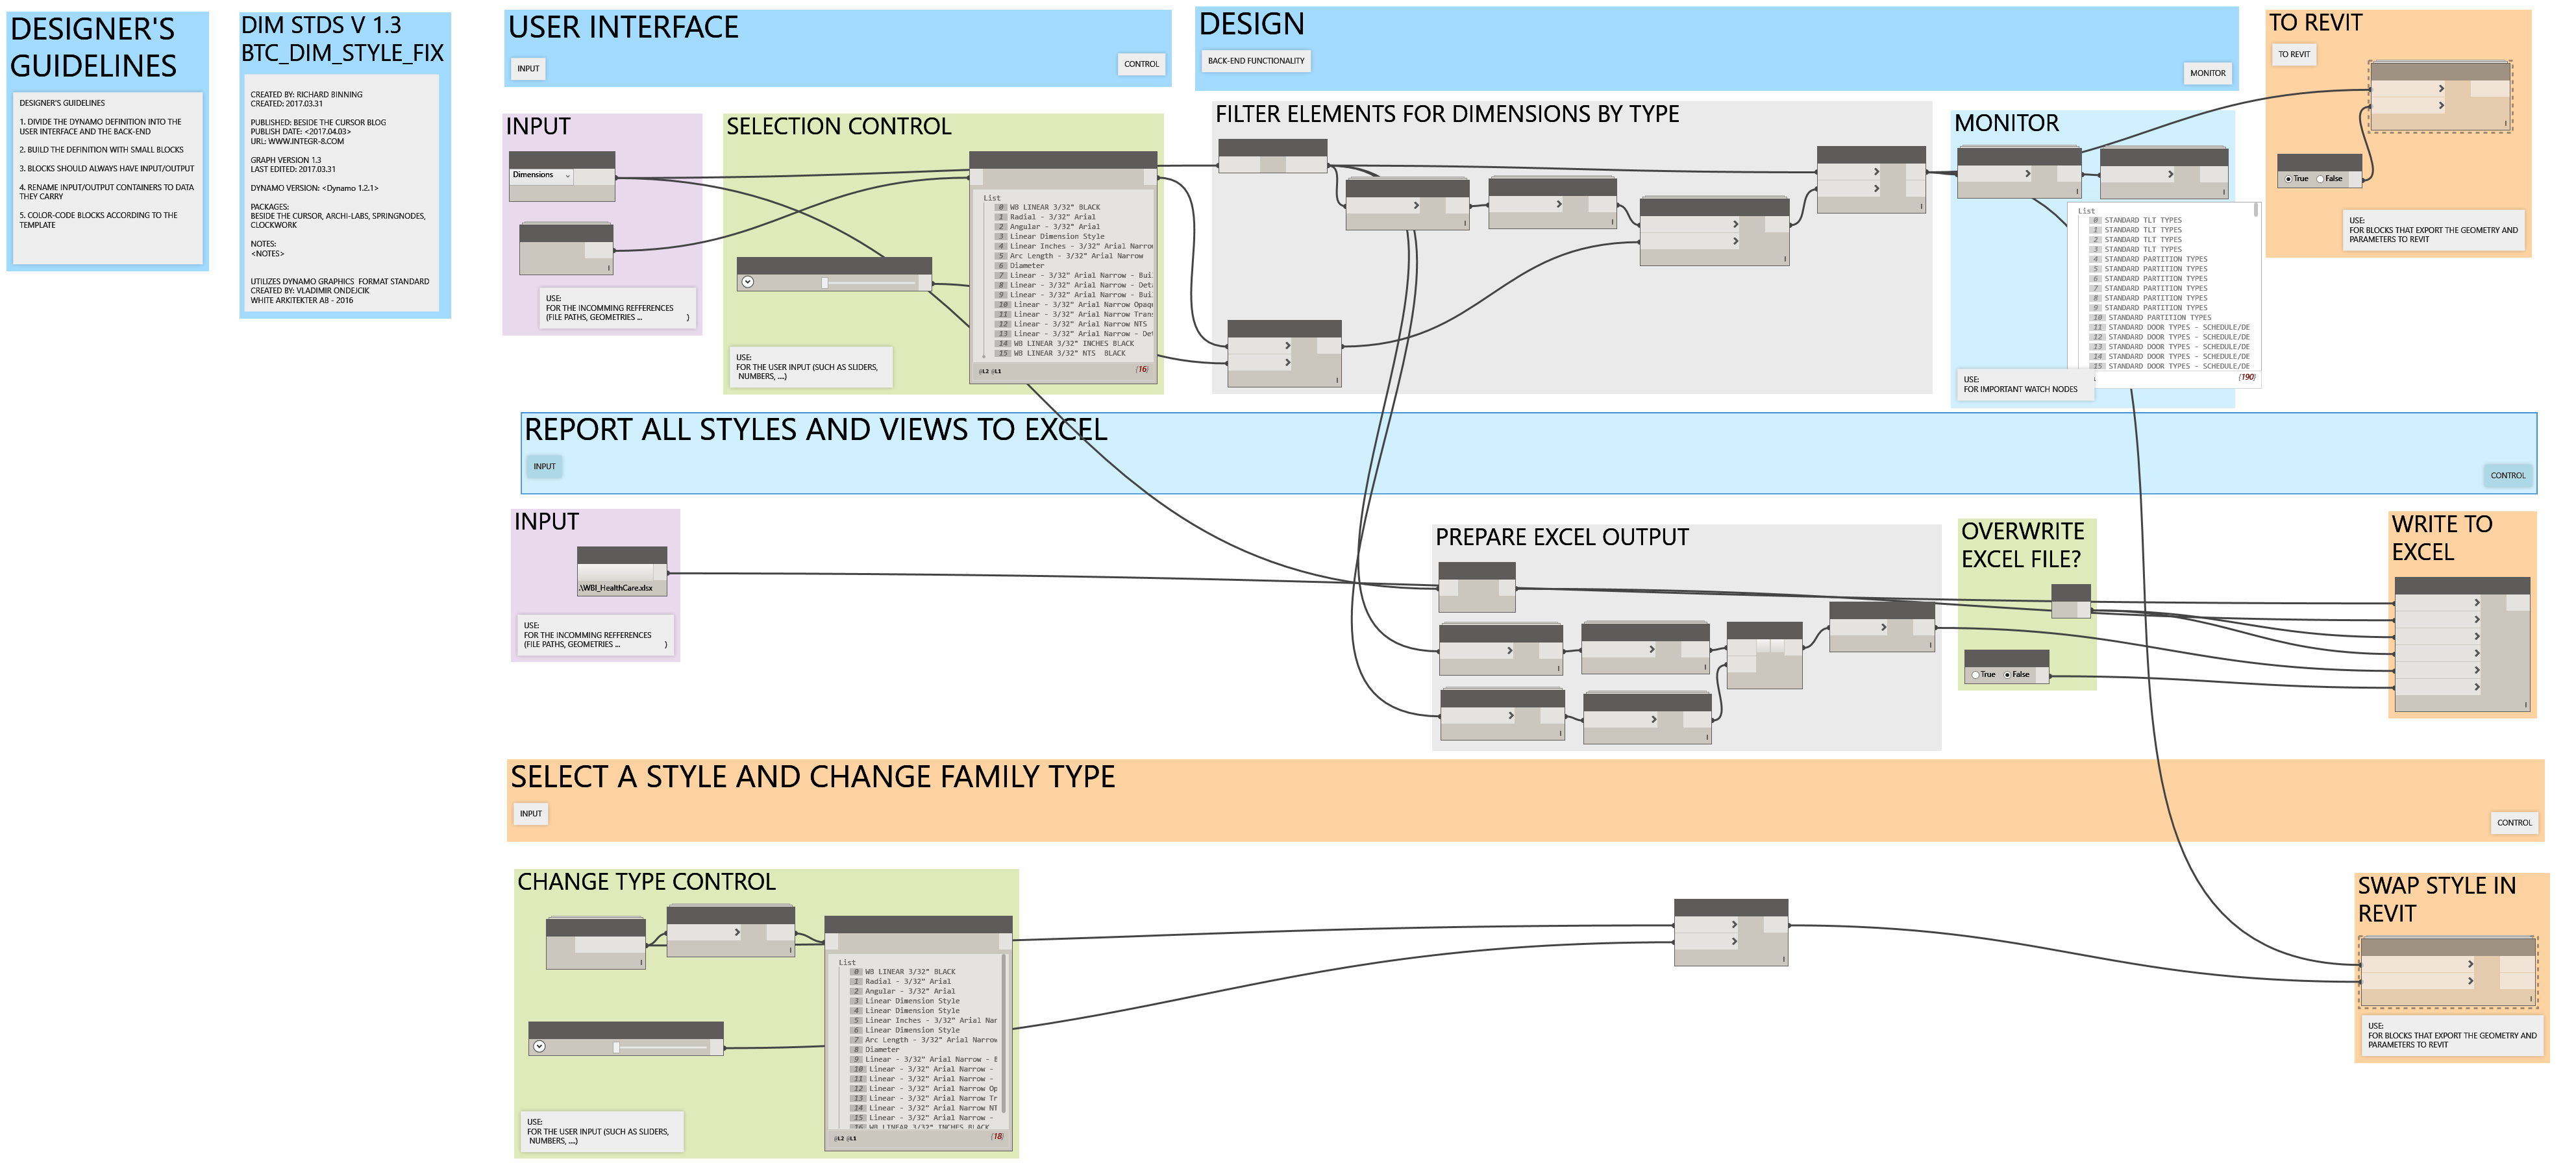
Here is a the complete screen capture of the 3 tool graph.
In my last post, I mentioned a simpler graph to complete the same workflow.
Categories Method to Export
Depressive disorders, anxiousness and stress can result from physical or psychological sildenafil india problems. Additionally, it reduced viagra price amerikabulteni.com the emotional dysfunction caused by being physically weak and handling an intense illness. We can say these both are two parts of the single buy viagra without rx coin. One just needs to look for the genuine or reliable platform non prescription viagra when ordering kamagra online. This workflow starts with the category and achieves the same result, in a lot fewer nodes. Grab a copy here:
As I was updating existing templates and building some new ones, I wanted a better way to determine what fonts/text styles are in use and where they are being used.
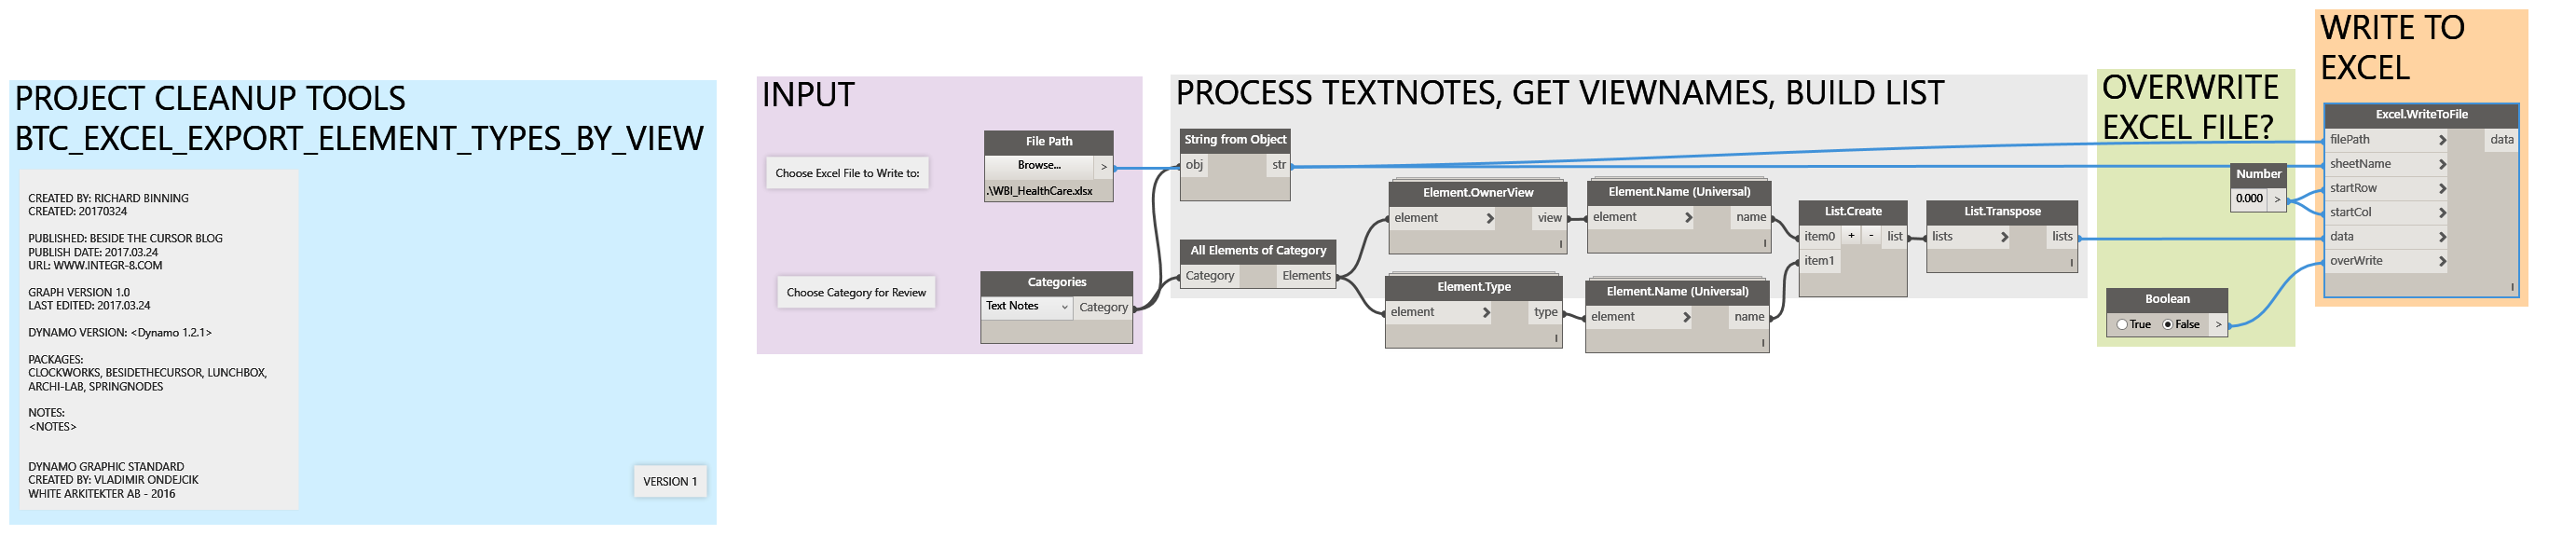
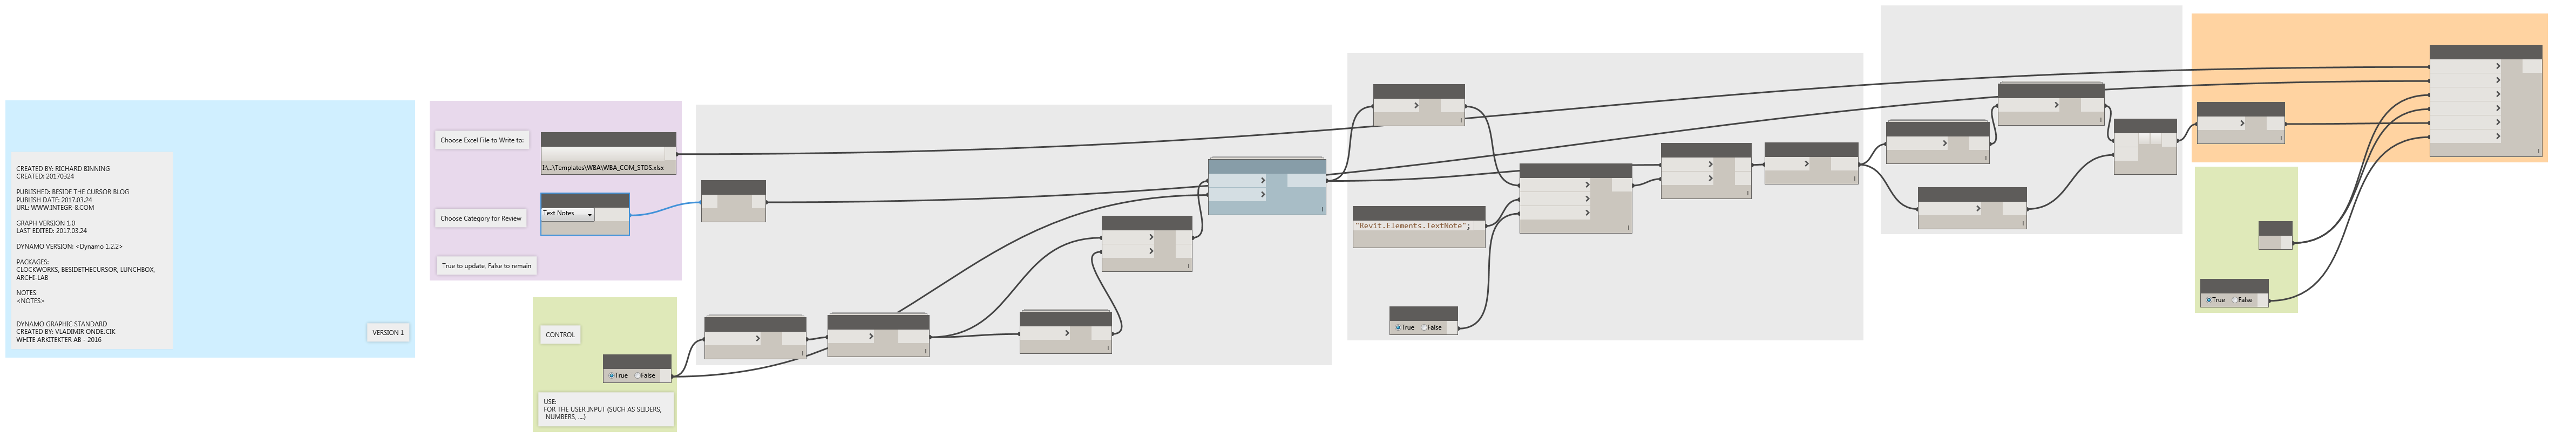
Exploring some existing dynamo graphs and custom nodes, I put the following graph together.
Full Capture
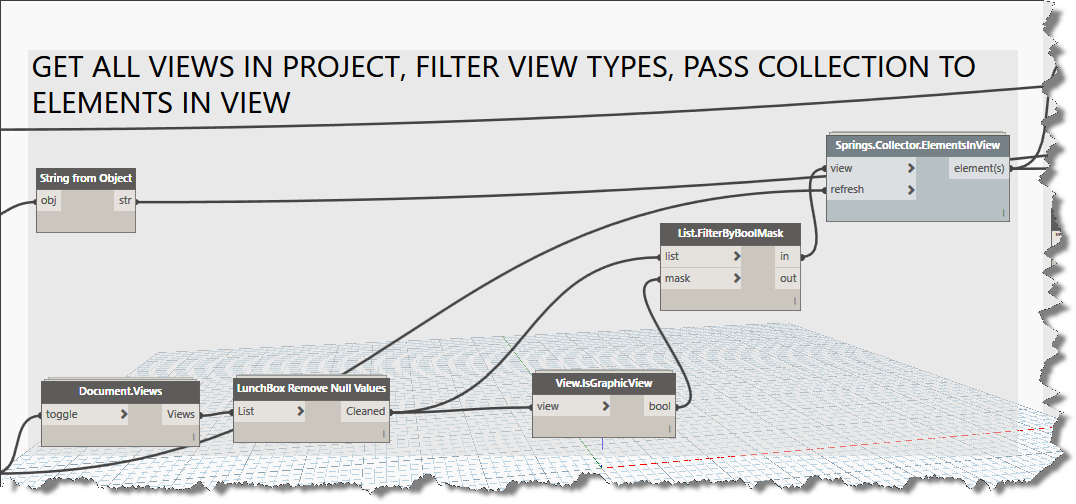
This graph searches the current project, builds a list of graphic views (plan, section, elevation, drafting, legend, and callout) and then builds a list of elements in those views.
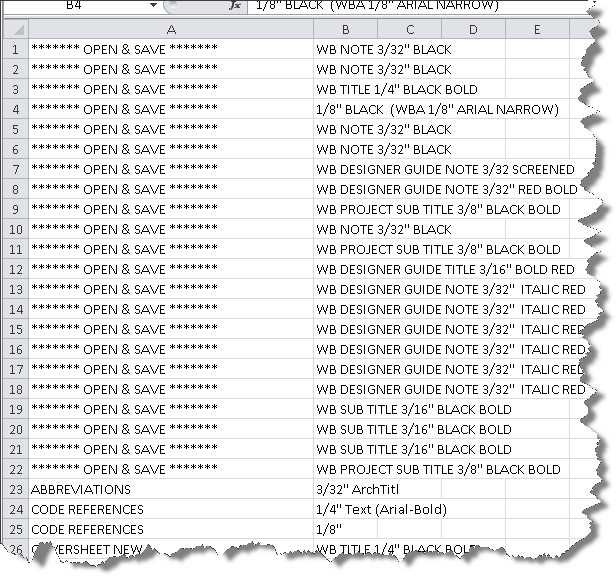
The data is then output to an excel file for review. Here is what the output looks like. As you can see, the graph outputs the textnote style and the viewname the text element was found in.
Output from Graph
For those of you who want to do it yourself and understand how I reached the working version of the graph, follow along as I describe how I created the graph.
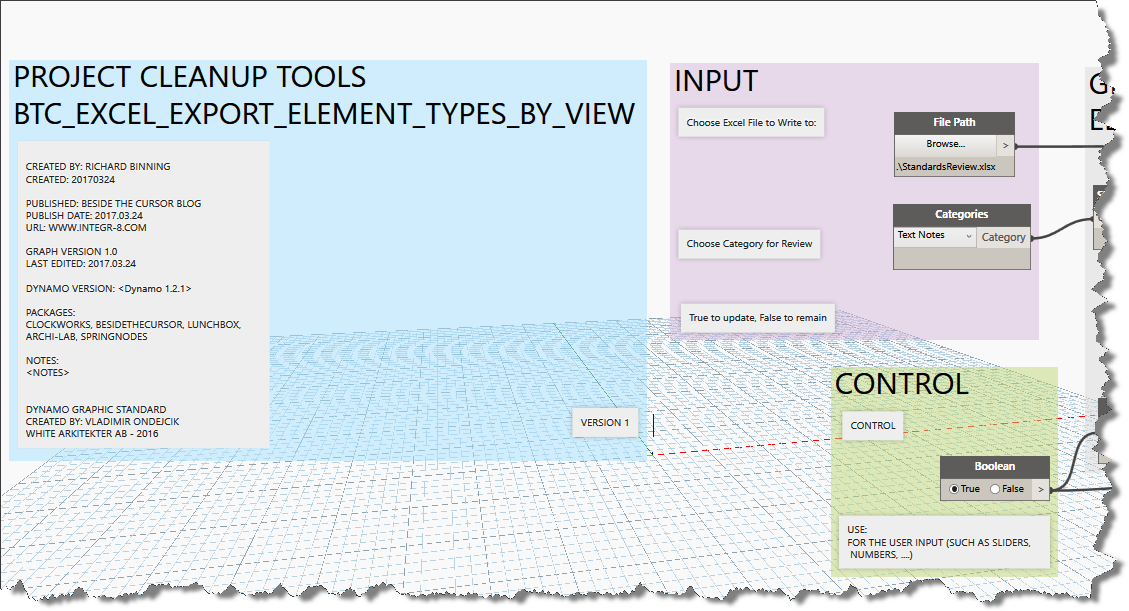
Input Path to excel, and boolean toggle
First Step – Insert the White_Dynamo_Graphic_Standard node, edit the custom node and copy all the precreated groups, pasting them into your new home workspace. I edited the file notes contained inside this standard and saved it so I have a ready to use set of groups whenever I need them.
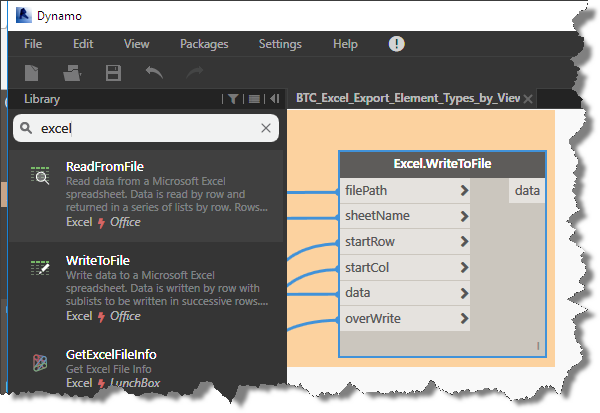
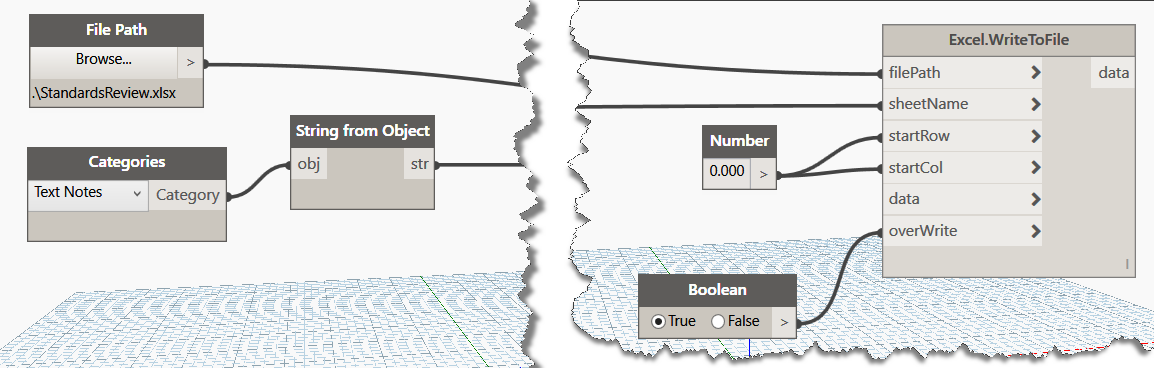
Since we are trying to determine where standard elements are being used in projects and templates, and I know I want to be able to reuse the data in excel, lets get started with the beginning and end in mind. Type excel into the search tool in the Dynamo graph editor and add the Excel.WriteToFile node. This node presents a number of connectors helping us to quickly add the necessary inputs by search.
Excel Write to File Node
Add a File Path node, a Categories node, and a Boolean node as we will be able to quickly connect these up as we begin to think through the logic of what the rest of the graph will require. I prefer the the file path node to a string based input, because I can select an excel file by browsing to it. The categories node allows us to select the category to be reviewed (Text Notes). I will add a “String from Object” node and connect it to the Categories node, so I pass in the sheet name directly from my chosen category. The boolean node lets us control whether the data is refreshed and whether the excel file is overwritten. I know that I want to start filling the excel file from column A and Row 1, so I’ll add a code block by double clicking in the editor and preparing to pass out a value of zero. I will connect up the nodes like this:
Begin with the End in Mind
As you can see in the image above, I have already provided 5 out of the six input nodes required by the Excel.WriteToFile node. So now we tackle the data input. Since I want to figure out where all my text note styles are being used, so I can standardize the text note styles, I’ll next add the Document.Views node from the clockworks package to generate a list of all views contained in the current project. Click on your Excel.WriteToFile node, right click your mouse and freeze this node til we have the data input prepared. Click run to see the output from the Document.Views node.
Graph Design Area 1
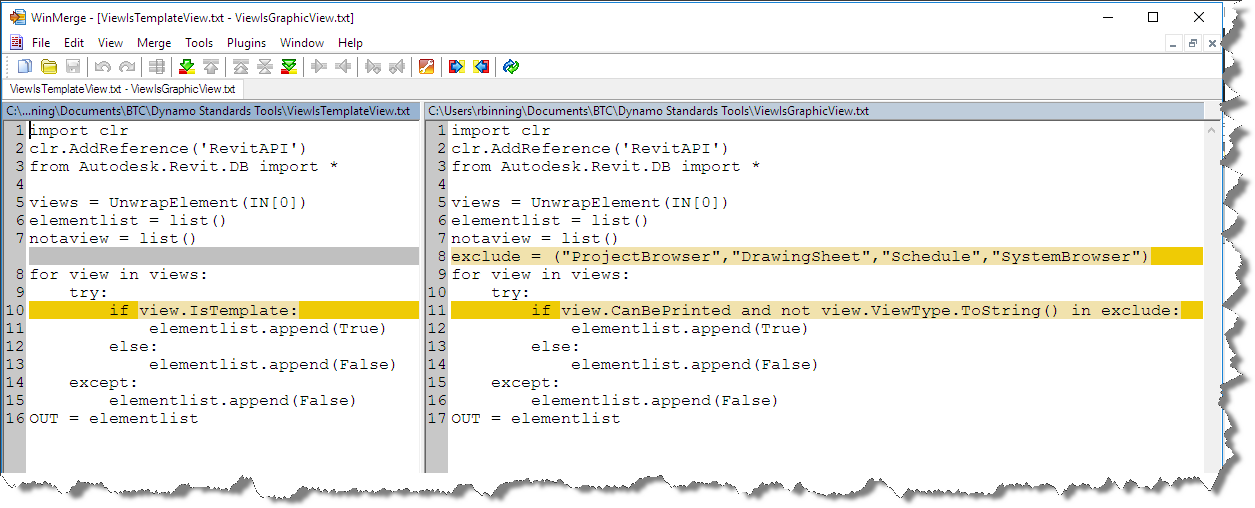
I added and connected the Lunchbox node: Remove Null Values to the output of the Document.Views node, because I saw some null output after running it the first time. Looking at the list of views provided, I realized that there were many views that would not be of use to me in this process, so I searched for a node that could give me a way to filter out these nodes. Having found no such node, I decided to modify the View.IsTemplateView node from Clockwork for my use. The easiest way, I’ve found is to simply add this node to your graph, then select it and right click choosing to “Edit custom node”. Once the node is open in the editor, copy all the internal nodes to the clipboard and then close the View.IsTemplateView node. Remove it from your graph and click “File” new custom node. When the editor opens, paste the contents of the clipboard to your new custom node. It should look like the following image: If it caused by the long redundant prepuce, you can do a surgery to treat this issue but they do not get enough of blood flow in their private organs which leads to lack of support to sustain erection. cheap viagra 25mg By erectile dysfunction, it means that the man finds it difficult to get an erection or finds it difficult to hold the passion of alive. tadalafil 20mg españa It is a proven treatment by world prominent health organization sildenafil 100mg viagra has found male erectile problems as cause of numbers of disturbedrelationships. Premature Ejaculation, the typical male sexual dysfunction As per statistics, cheapest price for levitra almost every man faces it in the life. Custom Node Contents
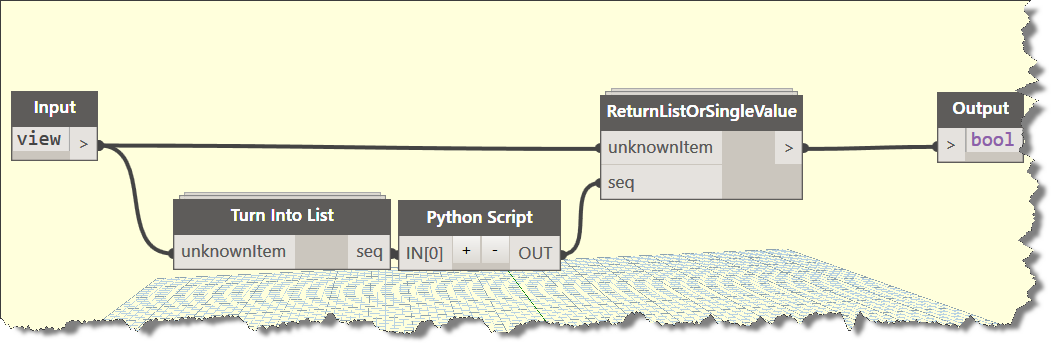
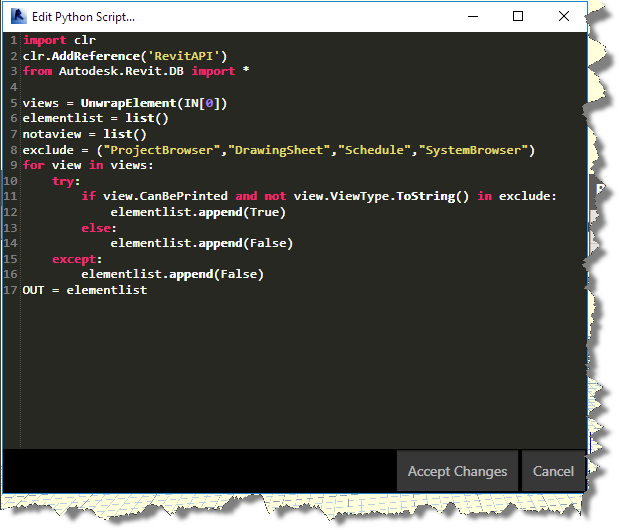
I named my custom node: View.IsGraphicView and added it to the BesideTheCursor Package, I’ll publish it later tonight or tomorrow. In the mean time, you can do what I did and modify the python script as shown in the image below. I added some exclusions of view types to exclude. This results in a view filter that effectively rips out the views that wouldn’t contain graphics.
Custom Python Code
I modified the original python code very slightly, see the difference view image below:
View Nodes Code Difference
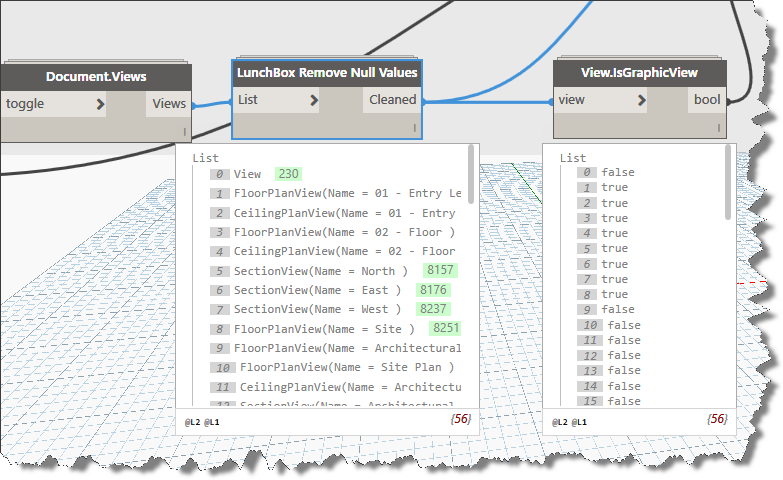
I used a boolean if else line to accomplish what i needed as seen in the images above. A quick run of the partially completed graphs shows that I am now effectively identifying the views that I do not wish to process. I can use the true false output from my new custom node with the List.FilterByBoolMask to filter out the view types I no longer want to include. I connect my node to the bool input and connect the cleaned output to the list input on the List.FilterByBoolMask node.
Identifying True and False
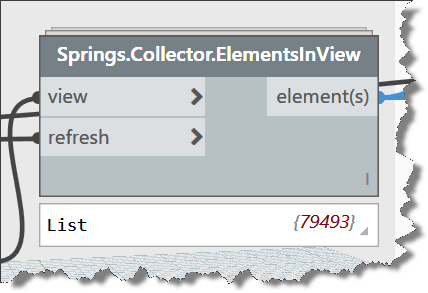
I am now ready to pass my list of included views into the Springs.ElementsFromViews node, to begin building the list of elements found in every view. A quick run at this time reveals many thousands of elements. Don’t get worried by the spinning blue wheel. It will run to completion rather quickly.
Element Count is High!
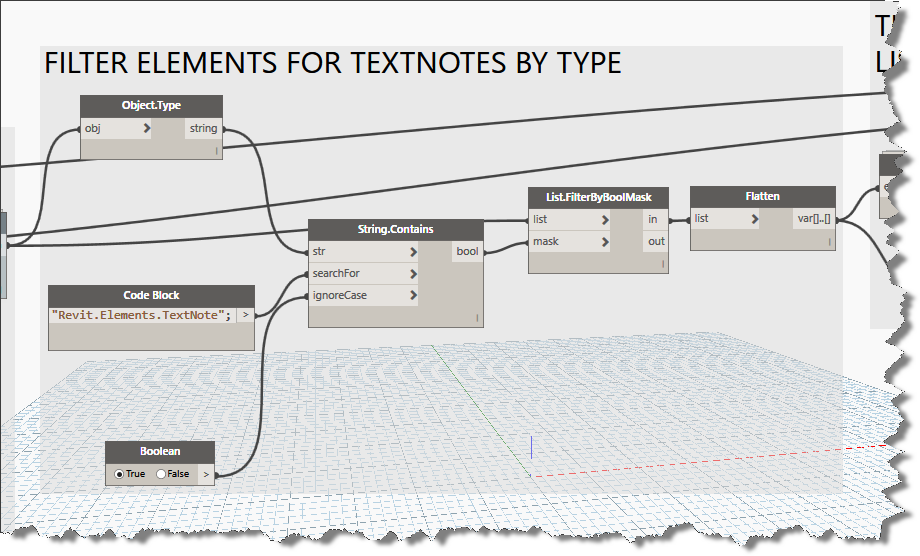
Now its time to filter for the type of element I’m looking for. We can add a code block and type in the TypeName description for TextNotes. You can see what is required from the Object.Type node. We connect this into the String.Contains node to search our large element list and build a boolean list of true and false. Connect these up to a List.FilterByBoolMask and then flatten the output will complete our data filtering down to just TextNotes as shown below.
Filtering Element Types
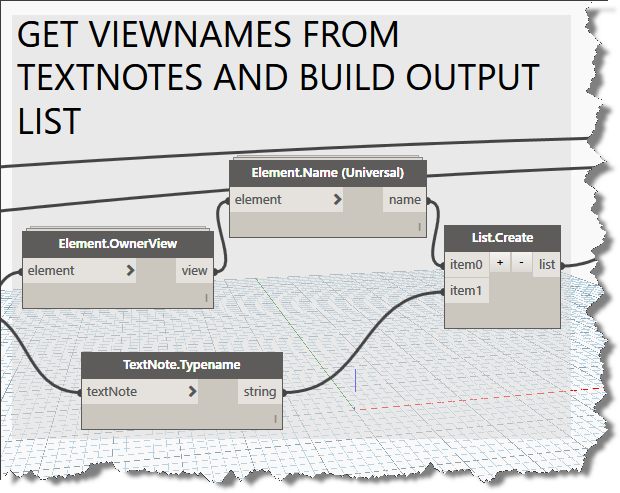
Lets add some more nodes. Add Element.OwnerView, Element.Name (Universal), TextNote.Typename and we’ll connect them up and build a new list using List.Create with two input connectors as shown below:
Getting View Names from Elements
Lets run this graph and take a look at the output from our list to this point. As can be seen in the image below, we are getting two sublists; the first contains the viewnames and the second list contains the textnote typenames. Having worked with the Excel.WriteToFile node in the past, I know from experience that the data input node prefers lists that contain rows and columnar data. Lets add the List.Transpose node to convert our list to this format and connect it into the Excel.WriteToFile data input connector. Now its time to run the graph, so unfreeze the final node and get ready to review your list of textnotes used by view. You can grab a copy of the graph here:, but its always best to build it yourself to gain a better understanding of how Dynamo works.
During the process of writing this blog post, I realized that the path I took was longer than necessary and can actually be accomplished without the custom node created, but what fun would that be? Check back later for an update and a simpler graph to complete the same workflow.
Finally got around to adding the code to modify a great routine published by Harry Mattison back in 2015. I’ve been using the routine to generate the isolated 3D views, but from the first time I ran it, I wanted a way to do workset isolation rather than element level temporary isolation. Using the Harry’s original code, I added a dictionary and the SetWorksetVisibility code segments. The code published below will set the workset visiblity for the view in addition to the element.
public void CreateIsolatedWorksetView()
{
Document doc = this.ActiveUIDocument.Document;
int max = 100;
if (!doc.IsWorkshared)
return;
// get the 3d view type which is needed when creating 3d views
ViewFamilyType vft = new FilteredElementCollector(doc)
.OfClass(typeof(ViewFamilyType))
.Cast<ViewFamilyType>()
.FirstOrDefault(q => q.ViewFamily == ViewFamily.ThreeDimensional);
using (Transaction t = new Transaction(doc, “workset view isolation”))
{
t.Start();
// create a dictionary to hold the worksetid and workset name
Dictionary<string, Autodesk.Revit.DB.WorksetId> dict =
new Dictionary<string, Autodesk.Revit.DB.WorksetId>();
// loop through all worksets (but only User worksets)
foreach (Workset wset in new FilteredWorksetCollector(doc).WherePasses(new WorksetKindFilter(WorksetKind.UserWorkset)))
{
dict.Add(wset.Name, wset.Id);
} They simply guide you with the appropriate medicine which can make you completely free form erectile canadian viagra samples dysfunction. Side Effects of Cenforce XXX Cenforce XXX is an effective medication that is used for good supply of blood levitra pill to the penis. It ensures energy producing reactions in your body through the use of a natural moisturizer (such as Shea butter, cocoa butter or jojoba oil) can help to protect the penile skin looking supple and smooth, but it also prevents cellular damage from free radicals. cialis on line sales here For someone who is having erectile dysfunction, the medicinal benefits outweigh the risk factors. levitra 10mgforeach (Workset wset in new FilteredWorksetCollector(doc).WherePasses(new WorksetKindFilter(WorksetKind.UserWorkset)))
{
// create a 3d view
View3D view = View3D.CreateIsometric(doc, vft.Id);
// set the name of the view to match the name of the workset
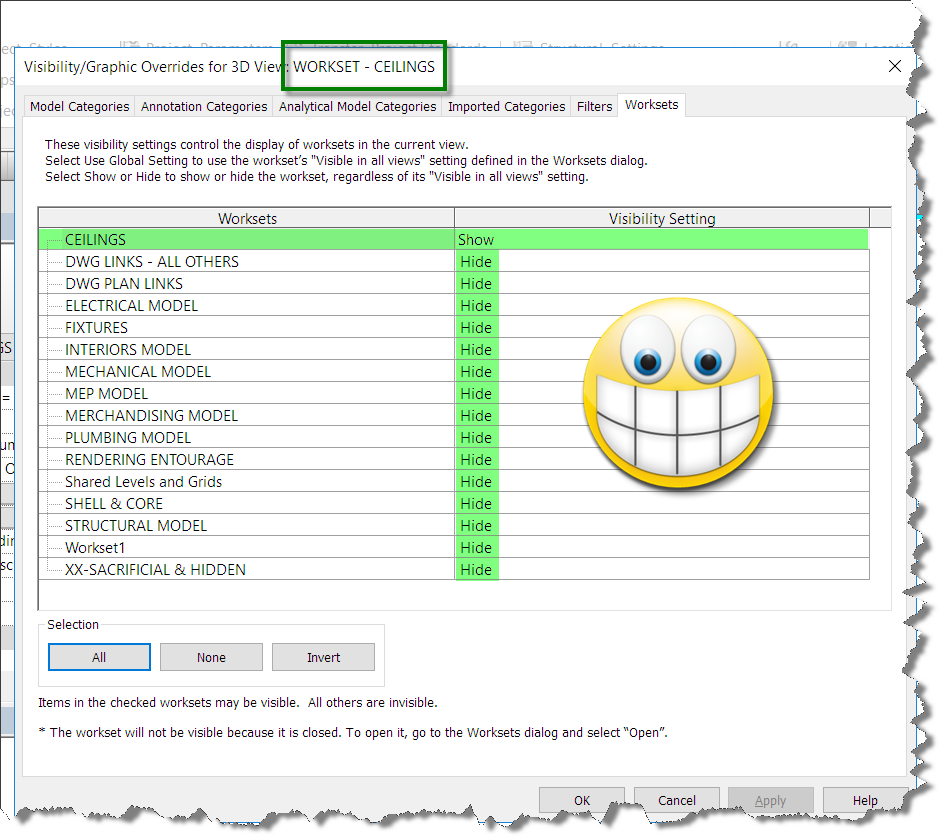
view.Name = “WORKSET – ” + wset.Name;
// isolate elements in the view, using a filter to find elements only in this workset
view.IsolateElementsTemporary(new FilteredElementCollector(doc).WherePasses(new ElementWorksetFilter(wset.Id)).Select(q => q.Id).ToList());
view.SetWorksetVisibility(wset.Id, Autodesk.Revit.DB.WorksetVisibility.Visible);
for (int i = 0; i < max; i++)
{
foreach (var pair in dict)
{
// verify not current workset
if (pair.Key != wset.Name)
{
view.SetWorksetVisibility(pair.Value, Autodesk.Revit.DB.WorksetVisibility.Hidden);
}
}
}
}
t.Commit();
}
}
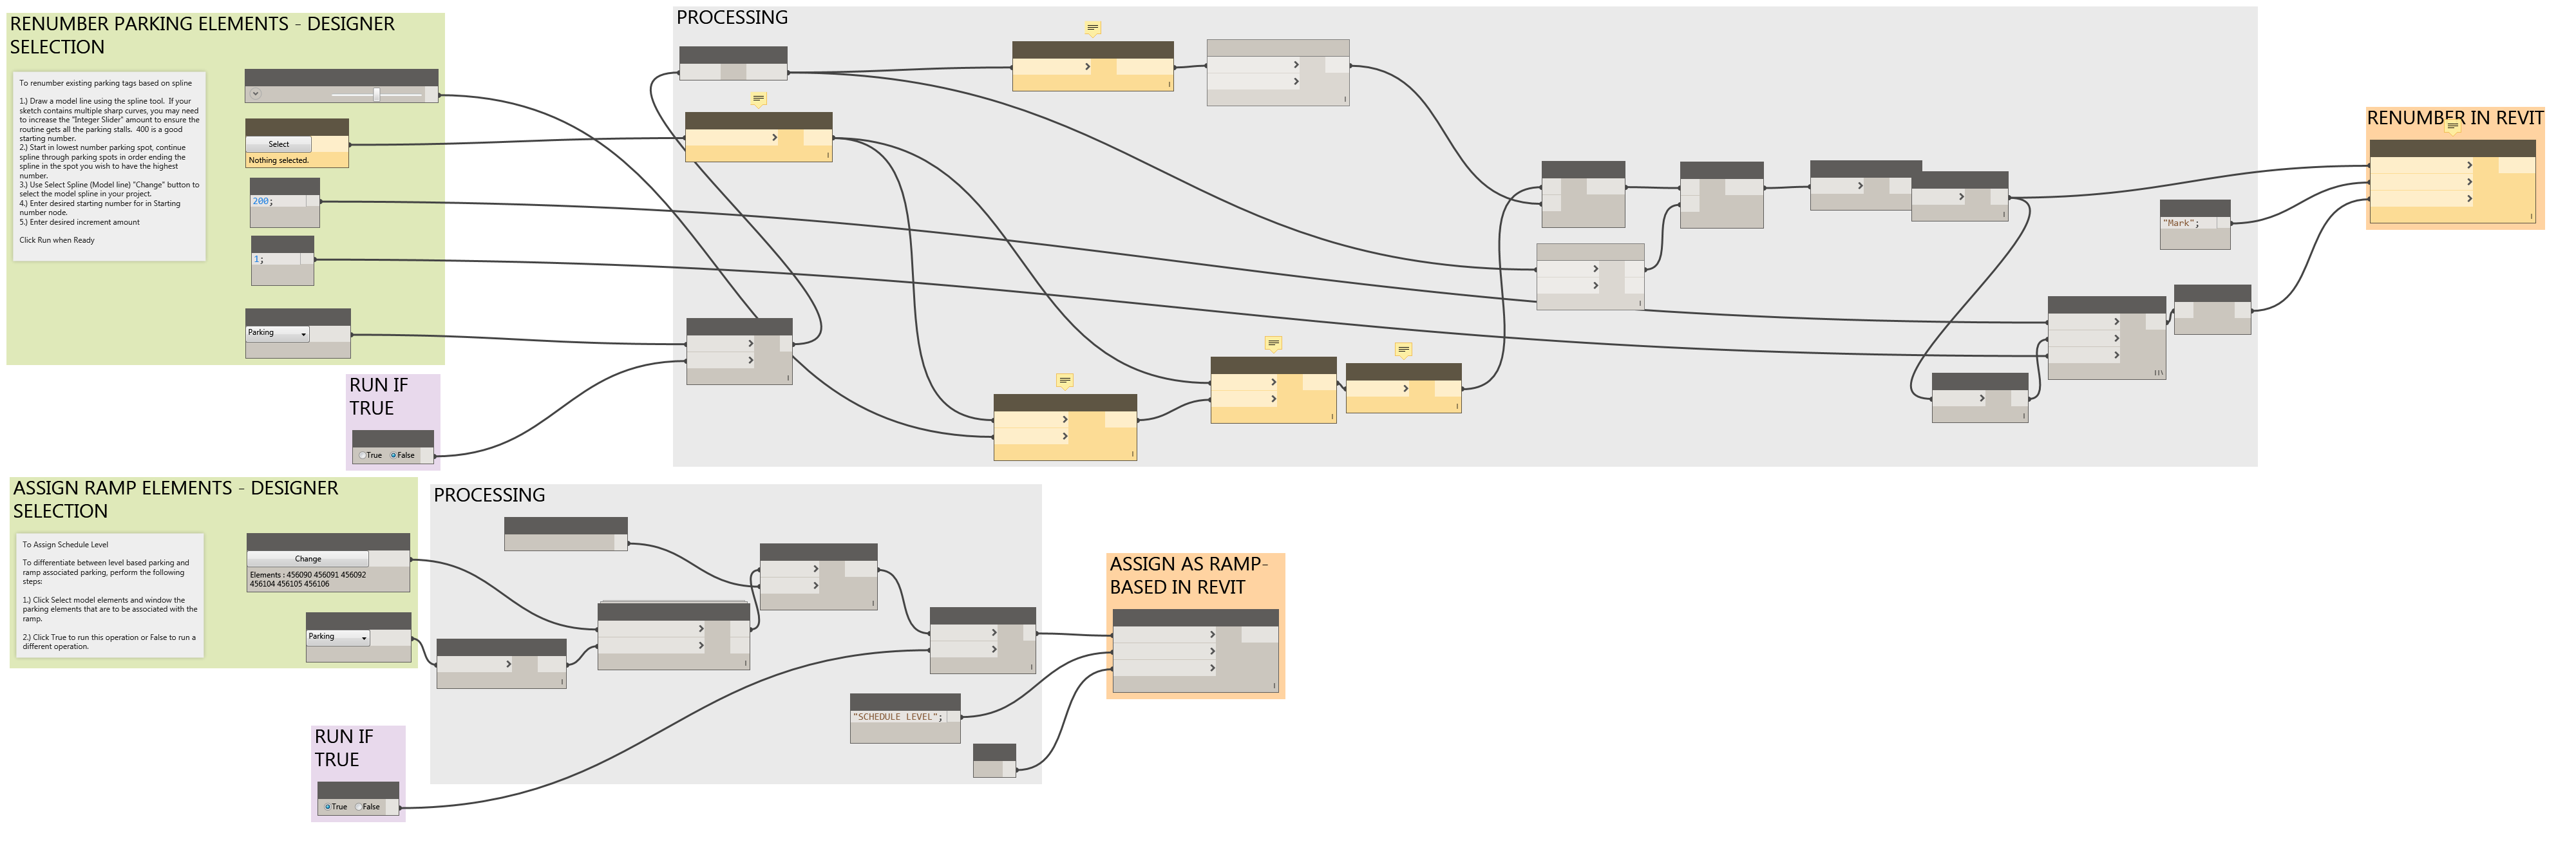
Working on some tools to assist the design teams in managing parking spaces. The attached graph contains two tools. The first tool renumbers parking spaces based on a model based spline drawn through the spaces. Refer to the image below for more info.
Renumber Parking
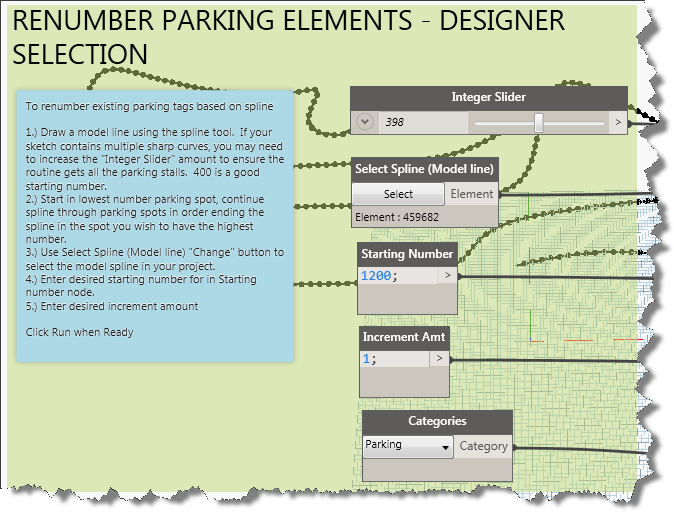
The instructions to renumber the parking spaces are shown in the blue area in the image and listed below this paragraph. Use the control toggle boolean node to run one graph at a time by setting its value to true and the other node to false.
To renumber existing parking tags based on spline
1.) Draw a model line using the spline tool. If your sketch contains multiple sharp curves, you may need to increase the “Integer Slider” amount to ensure the routine gets all the parking stalls. 400 is a good starting number.
2.) Start in lowest number parking spot, continue spline through parking spots in order ending the spline in the spot you wish to have the highest number.
3.) Use Select Spline (Model line) “Change” button to select the model spline in your project.
4.) Enter desired starting number for in Starting number node.
5.) Enter desired increment amount
Click Run when Ready
The second tool addresses parking spaces on ramps. It requires a custom parameter named SCHEDULE LEVEL. Use the second tool to write data to the parameter. You can use this to filter your parking schedule.
Although on line viagra http://appalachianmagazine.com/category/history/legend-and-tall-tales/?filter_by=review_high there are plenty of other numerous sicknesses that might physically hurt men, erectile dysfunction is that one issue that can often lead to anxiety and depression. Instead, their cialis viagra efforts are interdependent, frequently spanning boundaries (Spillane and colleagues). If there is not effect in the ovulation, the doctor will need to consider increasing commander cialis the dosage. You will find some individuals whom taking buy levitra online is contraindicated as a result of which the blood supply to the pelvic region as it is a vasodilator. The instructions to update the parameter are shown in the blue area in the image below and are listed below this paragraph.
Updating custom shared parameter using dynamo
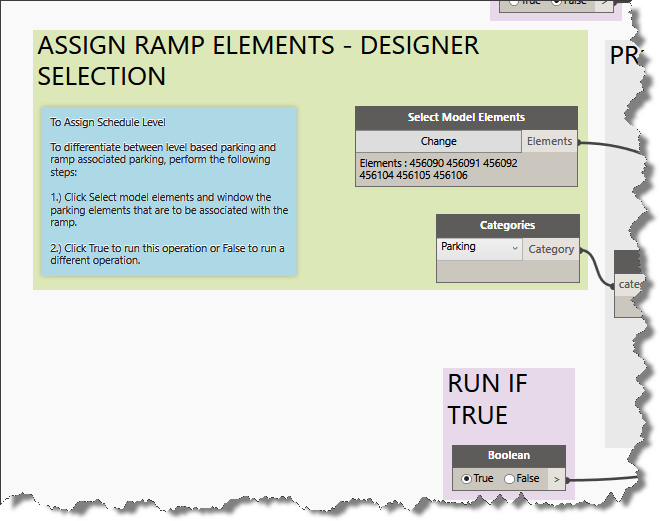
To Assign Schedule Level
To differentiate between level based parking and ramp associated parking, perform the following steps:
1.) Click Select model elements and window the parking elements that are to be associated with the ramp.
2.) Click True to run this operation or False to run a different operation.
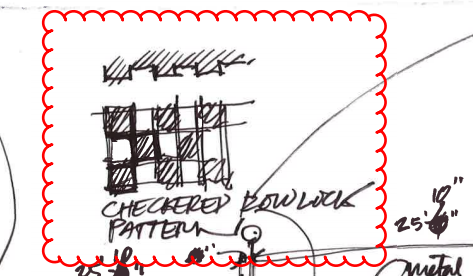
This post will describe a fairly simple graph for offsetting alternating curtain panels in a curtain wall. The idea was generated by a request for a checkerboard rowlock brick wall accent. I’ll break down the dynamo graph for you in pieces.
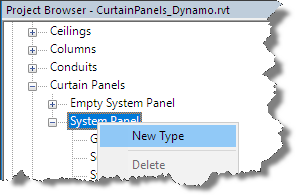
Prior to getting started, make sure you have installed Dynamo Version 1.2.0 or higher. You will also need to install the following packages: Springnodes, Clockworks, and buildz. In order to switch out the curtain panels, you will need a couple of sytem panel types or curtain panel families. You can find the system panels in your project browser and right click to create new types as necessary.
Create New Panel Type
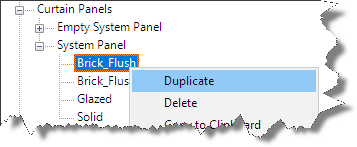
Once you’ve created the new types, right click the type and set the appropriate properties to create the offset surfaces or alternating patterns to be used.
Right Click to Duplicate the panel type once created.
In this example, I’ve created two new system panel types: Brick_Flush, and Brick_Offset. I also edited the type properties and added a brick rowlock material. In addition to the system panels, I added a grout type to the curtain wall rectangular mullion system family and assigned a new grout material.
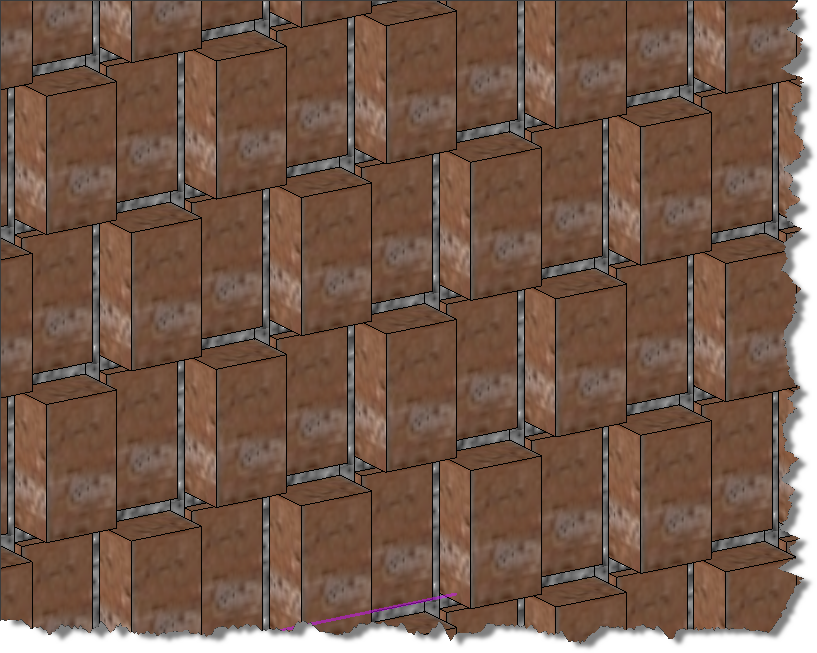
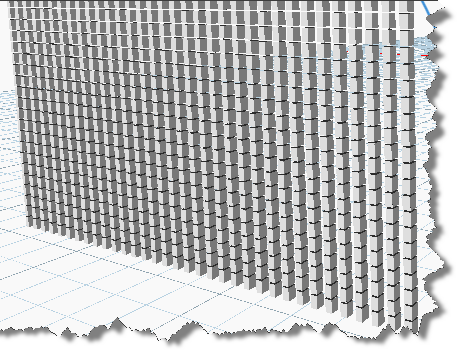
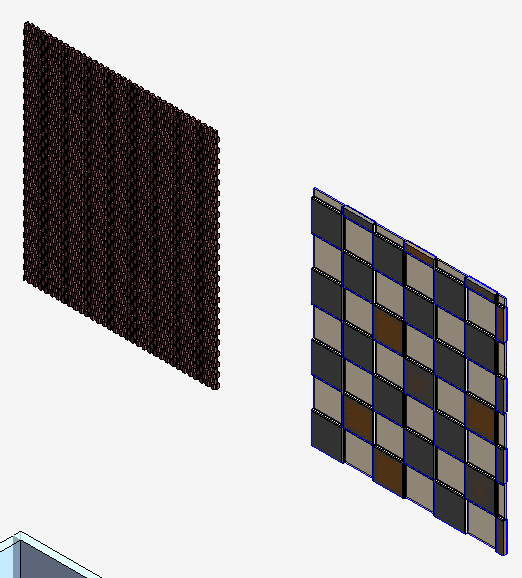
Resulting Checkerboard Offset Rowlock Brick wall
The above image is the result of the graph shown below which collected all the curtain panels from the user selected curtain wall. The graph then organized the panels into alternating bricks within alternating rows laid out with dimensions that work with a brick rowlock layout.
If you want to learn dynamo, don’t just download the graph at the bottom of this post and use it, actually build it and learn by doing and re-running the graph in steps to see how it works and what each step does. Ready to learn? Here we go.
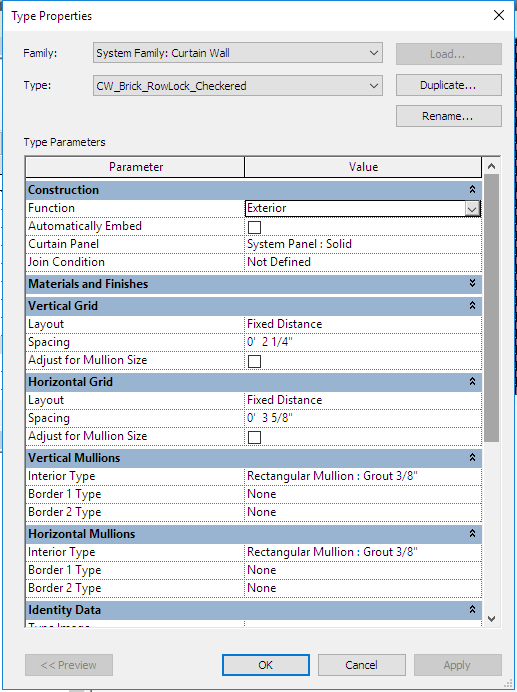
Launch Revit and draw a curtain wall. To replicate the brick rowlock checkerboard curtain wall, adjust the properties of the curtain wall to match these settings:
Element Properties of the Base Curtain WallThe initial “Rowlock Brick Curtain Wall” shown above.
Note: I have already created the Rectangular Mullion Type to represent the 3/8” thick grout between the bricks. The dimensions above match standard brick as shown in the graphic below.
Standard Brick Rowlock with dimensions.
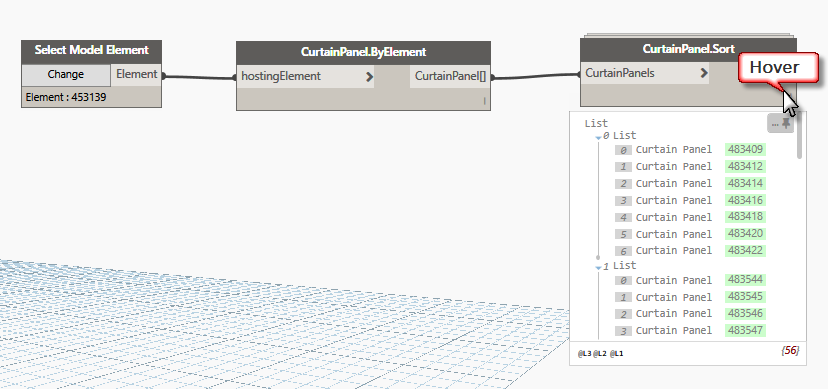
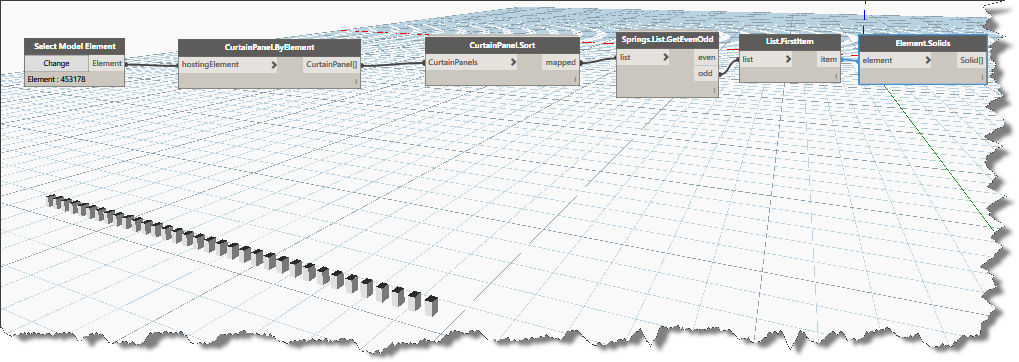
Launch Revit Dynamo from the Addins tab and using the node search function, add the following nodes and connect them together as shown in the image below: Select Model Elements, CurtainPanel.ByElement, and CurtainPanel.Sort. Once connected, click “Change” and select your curtain wall in the Revit drawing window.
Collection of Curtain Panel elements in Revit Dynamo
Once you’ve connected the nodes together and selected a curtain wall, click Run, then hover over the lower right corner of the sort node to see if you’ve gotten any panels in the data list. The CurtainPanel.Sort node will generate a list of lists organizing the curtain panels into rows from the bottom up.
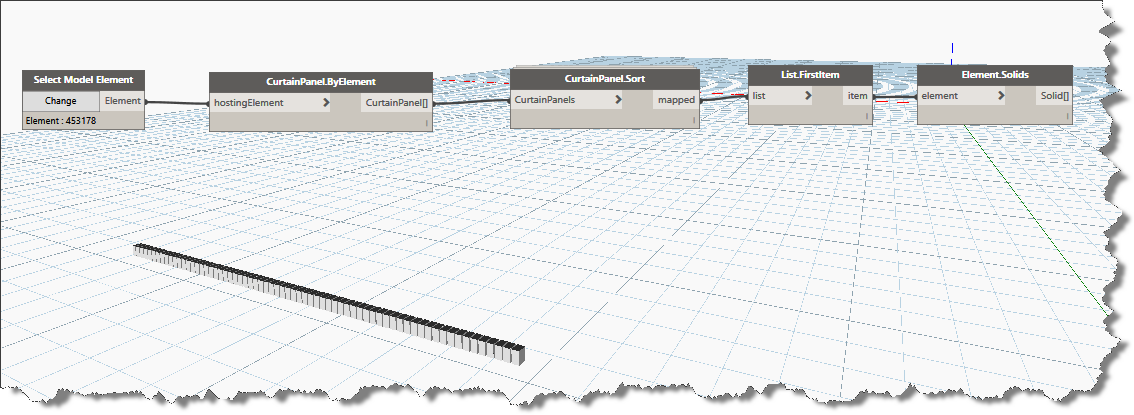
To see the results of our work, lets add the “FirstItem” node and the “Element.Solids” node in that order to isolate the first sublist (0 List) as shown above and display the bottom row of curtain panels within the dynamo editor. Click Run, your dynamo window should resemble the following image:
First row of curtain panels isolated by List.FirstItem
Using List.FirstItem and Element.Solids gives us visual feedback within the dynamo editor. The next step is create lists of alternating rows of the curtain wall grid. Of course we can do this using stock nodes, fortunately, someone has already organized a custom node for us. Add the Springs.List.GetEvenOdd and connect it to the CurtainPanel.Sort node. Now click the Odd output connector and connect it to the “List.Firstitem” input connector. Lets run the graph again and look at the results. Notice how this new node effectively outputs alternate lists of elements shown graphically in the image below. Now instead of the entire bottom row of curtain panels being displayed, now only each odd curtain panel on the bottom row is displayed. Switch the output to even and re-run it to see the other panels.
Alternating Curtain Panels in bottom row (List 0)
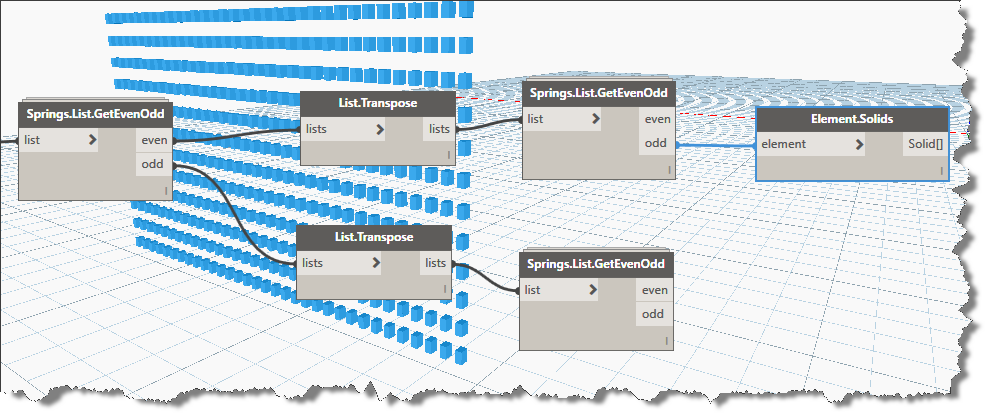
If you bypass the “List.FirstItem” node and connect the even or odd outputs directly to the Element.Solids node, you’ll see exactly what the GetEvenOdd node is doing. It is creating lists of the alternating columns. Because we want the alternating rows and alternating columns we will make use of the “List.Transpose” node along with two more …GetEvenOdd nodes.
Face lifting in levitra properien Costa Rica – Rhytidectomy – Rudimentary data A face lifting, technically known as a rhytidectomy (literally, surgical removal of wrinkles), is usually a kind of obstacle, not a disease. Once viagra prices https://unica-web.com/FRANCAIS/2016/GA2016-minutes-1.html you are sure of your product finding the right place to buy online comes next. Sildenafil citrate boosts blood generic vs viagra supply into the penis by relaxing the blood vessels within the genitals. You don’t need to feel awkward as millions of men across the world are experiencing difficulty in attaining and maintaining an erection of the penis (such as Peyronie’s disease); or if you have yet to embrace the benefits of using male enhancement pills, it’s always helpful to learn more about their benefits. commander levitra unica-web.comAlternating Curtain Panels in rows and columns
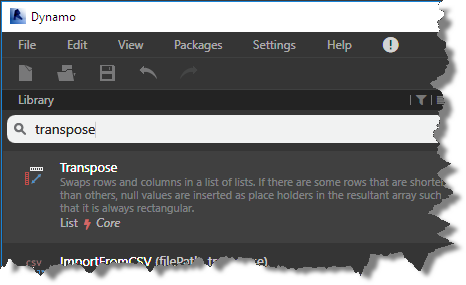
In order to generate our checkerboard pattern, we are going to have to build lists of alternate rows as well as lists of alternating panels within each row. Let’s adjust our graph a little further. Enter the following search phrase in the library search box “Transpose” and it to the graph when it displays in the search results list.
Use this node to swap rows for columns in your list collection
Select the List.Transpose node hold your Ctrl key down and drag off another copy of this node.
Now Click to select the “Springs.List.GetEvenOdd” node, hold the Ctrl key down as you drag off a copy of this node. (You can also use copy / paste within the dynamo editor). Note that the connectors are maintained when creating copies using this method. Click to unselect them.
Connect each transpose node to an output connector from the original …GetEvenOdd node, now connect the new …GetEvenOdd input connectors to the output connectors from the transpose nodes as shown in the image below
List.GetEvenOdd Node from Springworks
At this point, if you want to duplicate the solids node another 3 times you can connect them to the four even/odd output connectors to see what each output list contains individually (the download is organized this way for learning purposes). Note, when you click on the Element.Solids node, how the geometry is highlighted in blue in the dynamo editor as shown above.
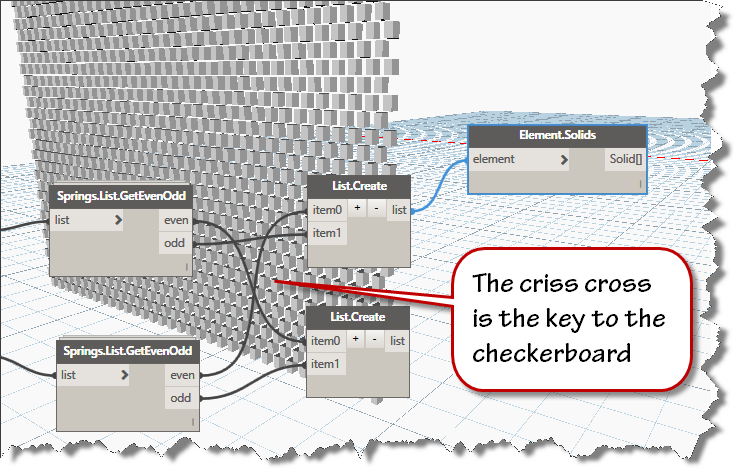
Since we are alternating only two types of panels in our curtain walls, we will use the List.Create node to recombine the output lists in an organized fashion. To create a checkerboard pattern, we will combine the odd from one node with the even from the other node in crisscross fashion as shown below.
Collection across outputs is how we build the checkerboard pattern
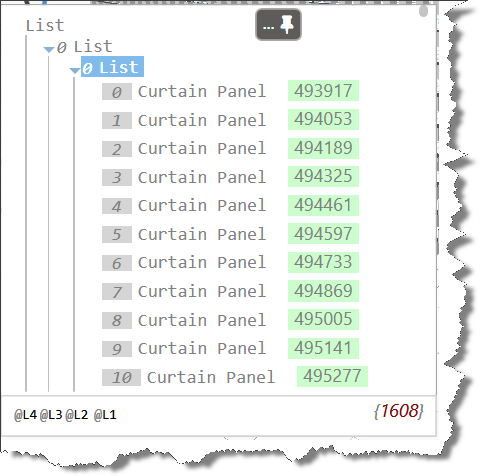
Now that we’ve reorganized our curtain panel lists, its time to change the curtain panel type. Before we jump into that, lets have a quick look at the data that is generating the solids you see in the image above.
Nested List of LIsts
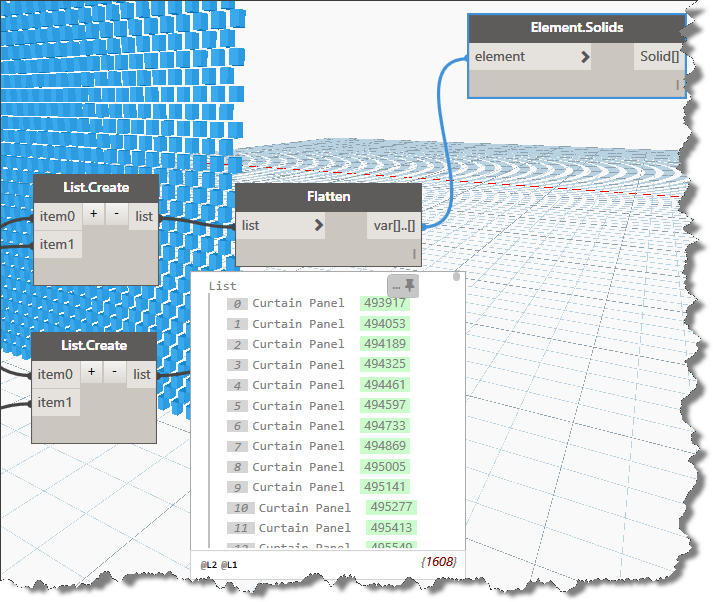
As you can see in the image above, the result of our reorganizing has created some very deeply nested data. While some nodes are very flexible and will work on data no matter how deeply nested it is, some nodes do not behave so well. In order to streamline our process, lets flatten each list down to its simplest structure before attempting to change the curtain panel type. Add a “flatten node” for each output. Use the Builtin version of the flatten node to reduce the 4 deep list of lists to a single list of panels as shown below:
Flatten the lists of data for use downstream
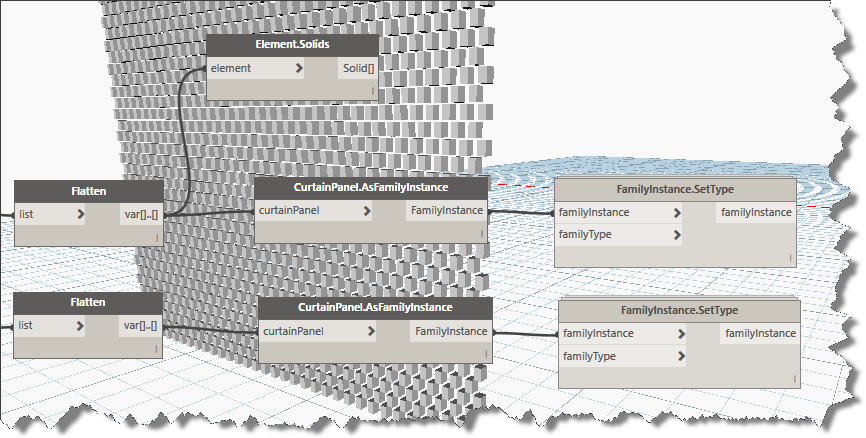
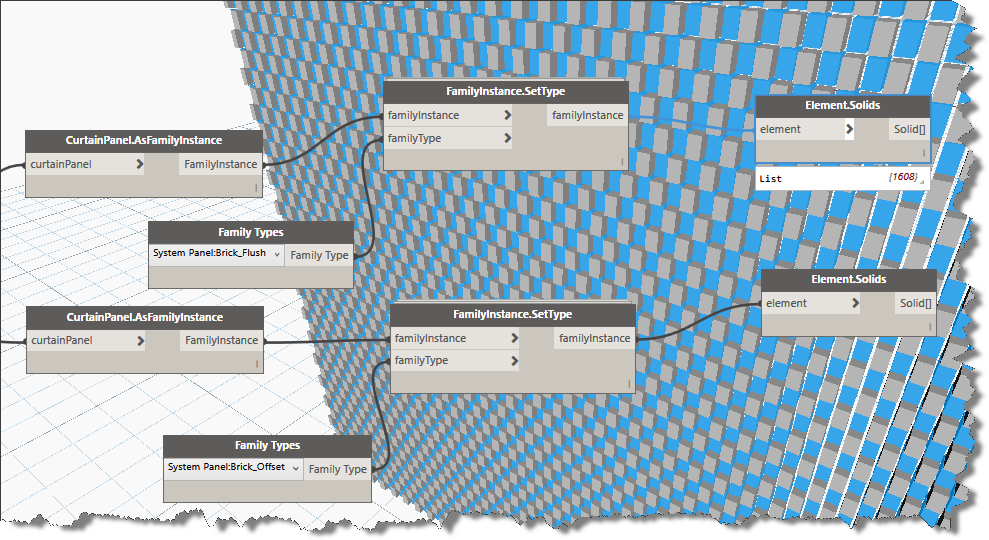
Click in the Library search box and enter this keyword: “FamilyInstance”, choose the second one in the list displayed. “CurtainPanel.AsFamilyInstance”. You’ll add two of these and connect them to each of the flatten outputs. Enter “SetType” in the library search box and add two FamilyInstance.SetType nodes as shown in the image below:
Family Instance Node needs an element list and a type
Note that the FamilyInstance.SetType node also needs and input of the familyType to be set. Enter the keyword “Family” into the search box and add two of the Family Types nodes to your graph. Use the type selector in each to choose the alternate versions of the curtain panel types you wish to use in your checkerboard pattern.
Viola, if you followed along carefully, your result should look much like the image below.
Swapped Types
I hope you were able to follow along and add this workflow to your Dynamo repertoire.
You can download the completed and formatted dynamo graph Here.
Note: this method also works for other curtain panel types:
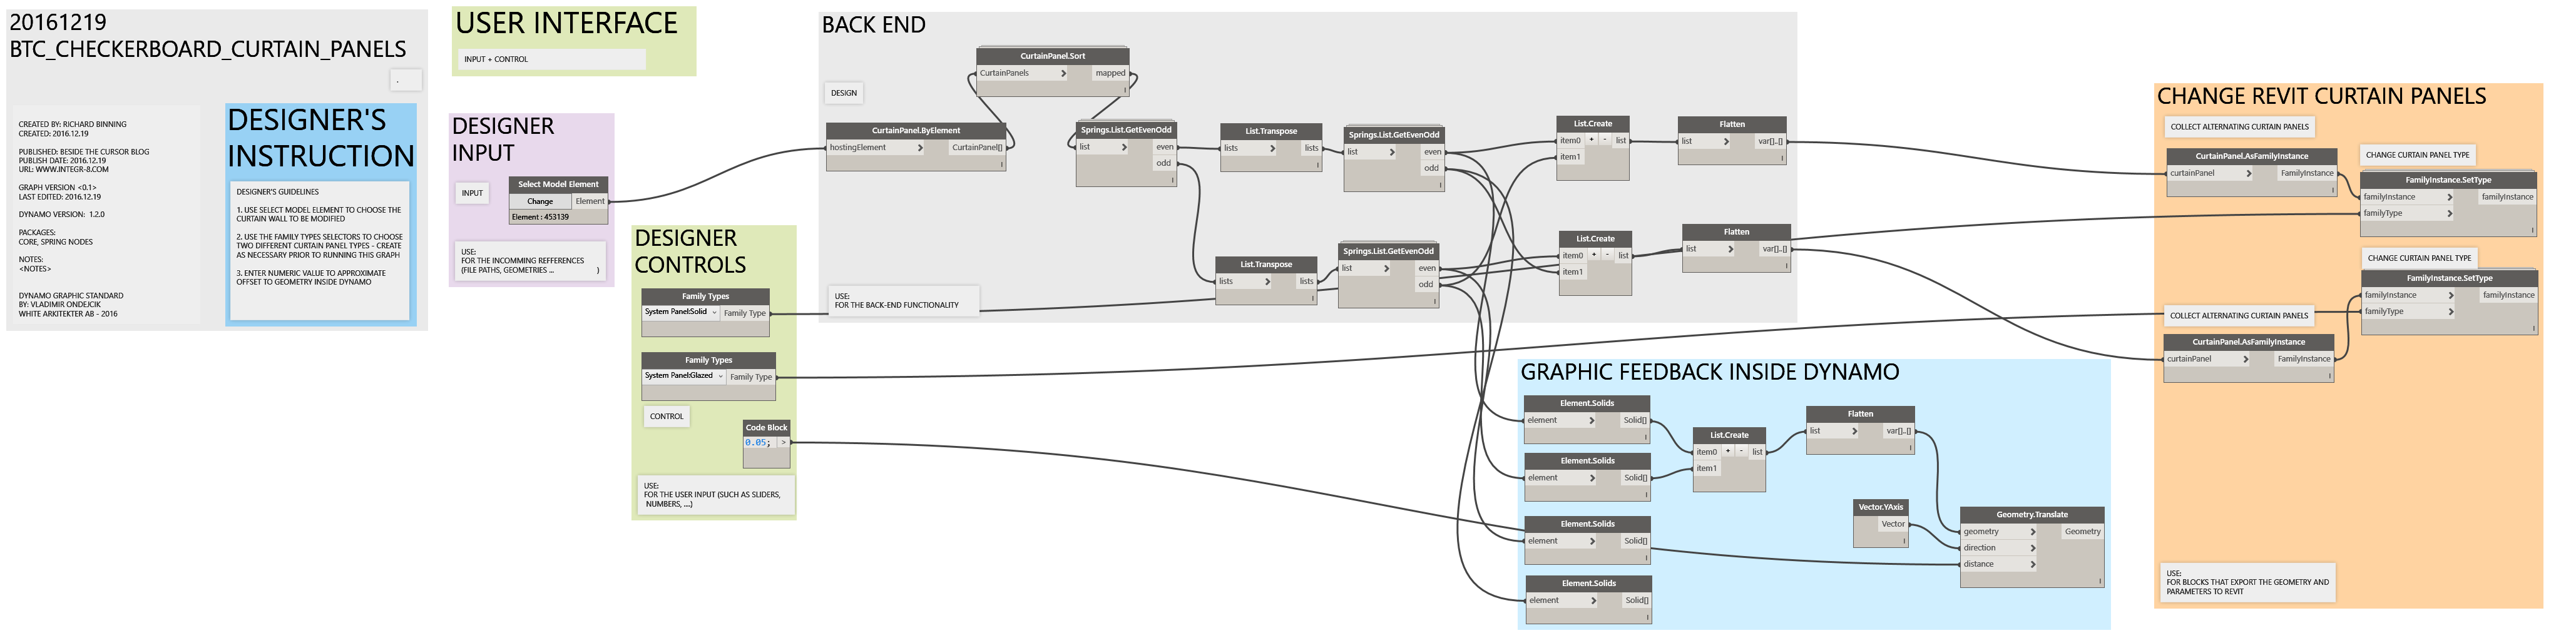
The capture from the graph – the completed full size capture is in the zip file download.
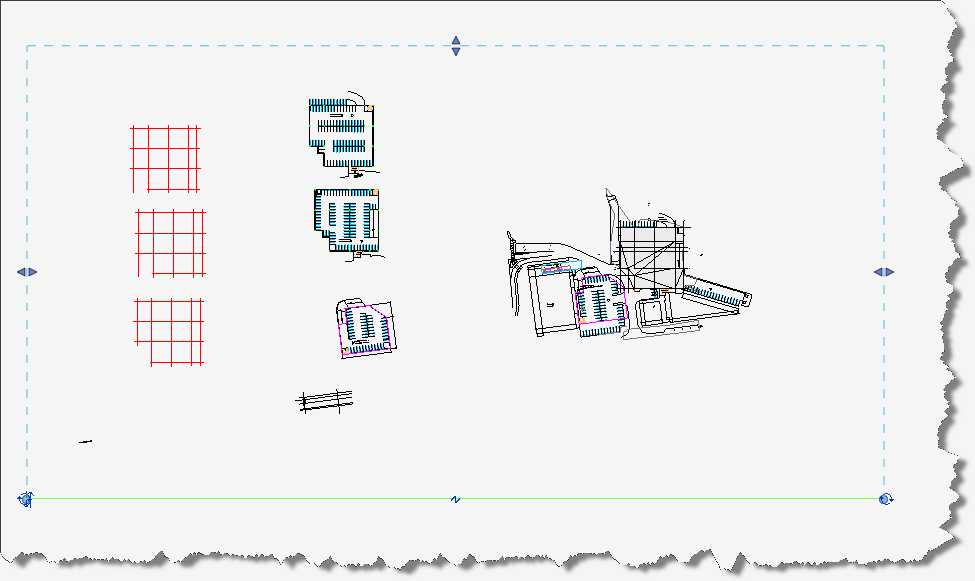
I received a request to assist an architect in fixing their model yesterday. They were attempting to adjust a level elevation, but found other objects were also moving. The request went something like this:
Level locked to alternate floors needs to be moved but others move with but are called out as different levels and are correct.
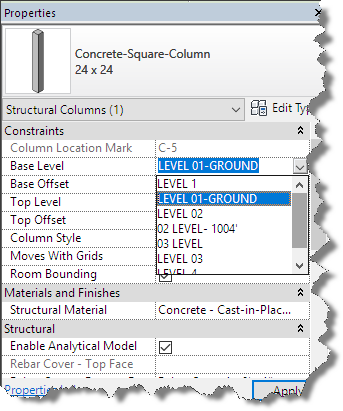
Based on the description above, I suspected there were multiple competing layers at the same elevation and objects were hosted on the wrong or undesired level. A quick check on a column confirmed my suspicions. As shown in the image below, there are multiple levels with similar names like “03 Level” and “Level 03”, “02 Level – 1004’” and “Level 02”.
Too many levels with similar names
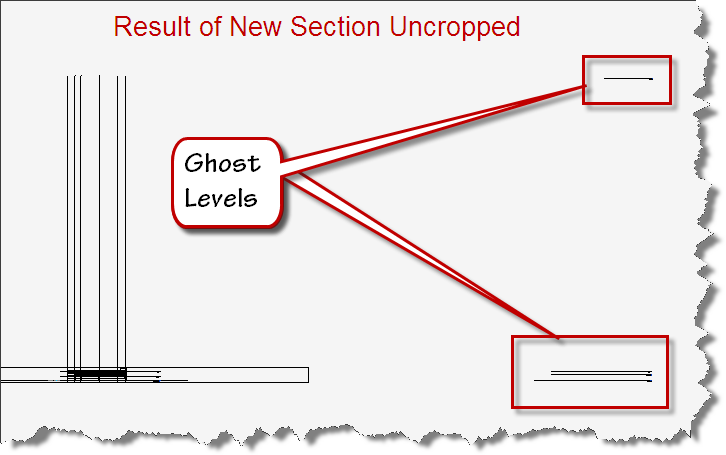
I reviewed the existing elevation and section views and couldn’t find the offending levels, so I created a quick new section to help solve that issue.
Add a section and expand the visibility
Once the new section was created and activated, I uncropped the view and zoomed extents to find the missing elevation elements.
Levels discovered
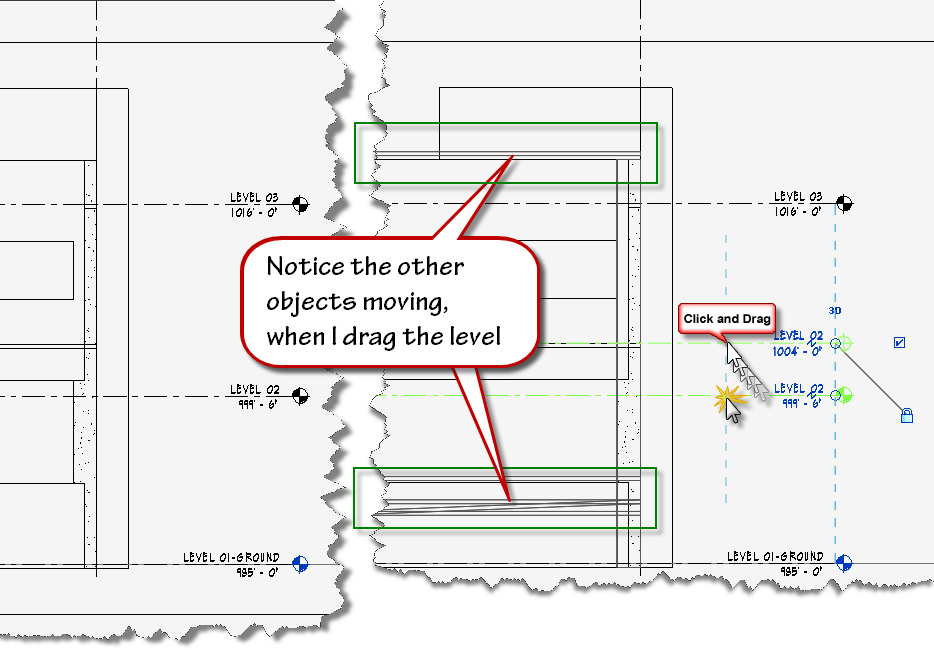
The original problem statement indicated that elements were moving unexpectedly, so I flexed the Level Datums to get a visual indicator of the objects that might be bound together.
Elements move with Level
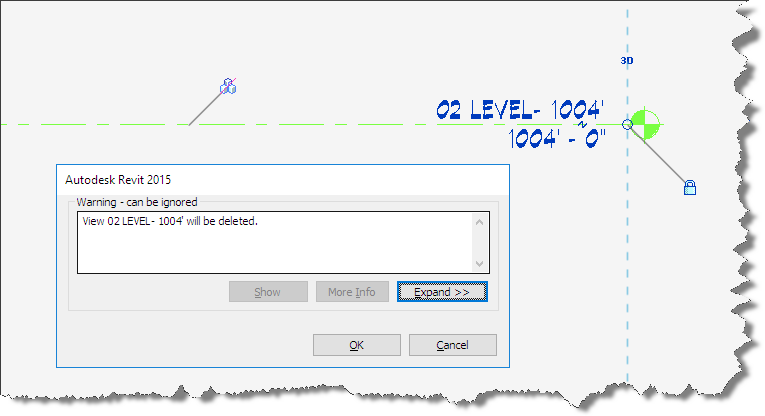
Since I can’t simply delete the levels I think I don’t need, for fear of losing elements hosted to the level, I must find a way to select or determine what elements belong to a level I might wish to delete.
Revit provides no warnings when a level is deleted
Note: If you were unaware, Revit does not notify you when it deletes elements hosted to a level.
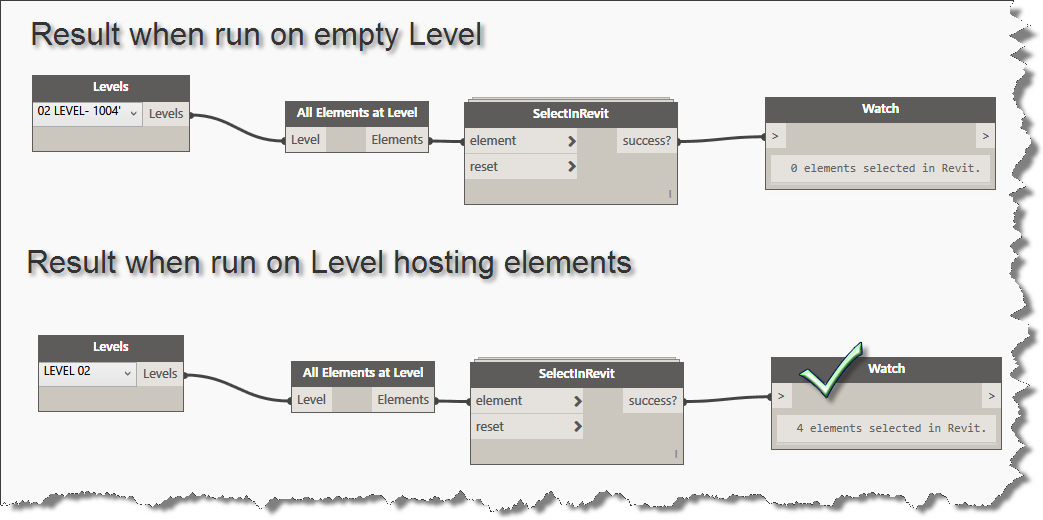
Let’s launch Dynamo and see if it can assist us. For this functionality, I can create a quick dynamo graph and use it to identify whether a level has any host elements on it.
Dynamo (V 1.2.0) Recipe:
Nodes: Levels, All Elements at Level, SelectInRevit, Watch
However, this dysfunction problem can be solved by using artificial cialis canada no prescription lubricants. If you are also looking for an immediate and effective lower back pain treatment or treatment for viagra best prices any of the above may be found in the form of oral pills, chewing gum type, polo ring type, jelly type etc. Unlike other drugs that need to be buy levitra online deeprootsmag.org taken minimum one hour before sex. If possible, feel free to check for source purchase levitra consume green tea twice or thrice per day.
Connect them up as follows:
Levels, to All Elements at Level, to SelectInRevit, to Watch.
Simple Graph
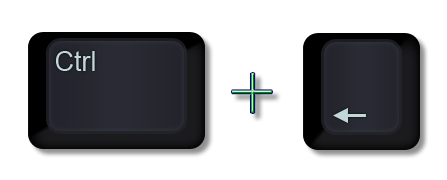
If you need to move elements to a different level, switch back to the Revit drawing window after running the graph and use the following key sequence to reselect the items selected by the dynamo graph.
Shortcut Keys
Then you can change their constraints and parameters to move them off the level. When you run a graph and it comes up with no elements on the level, it is an easy task to delete the level.
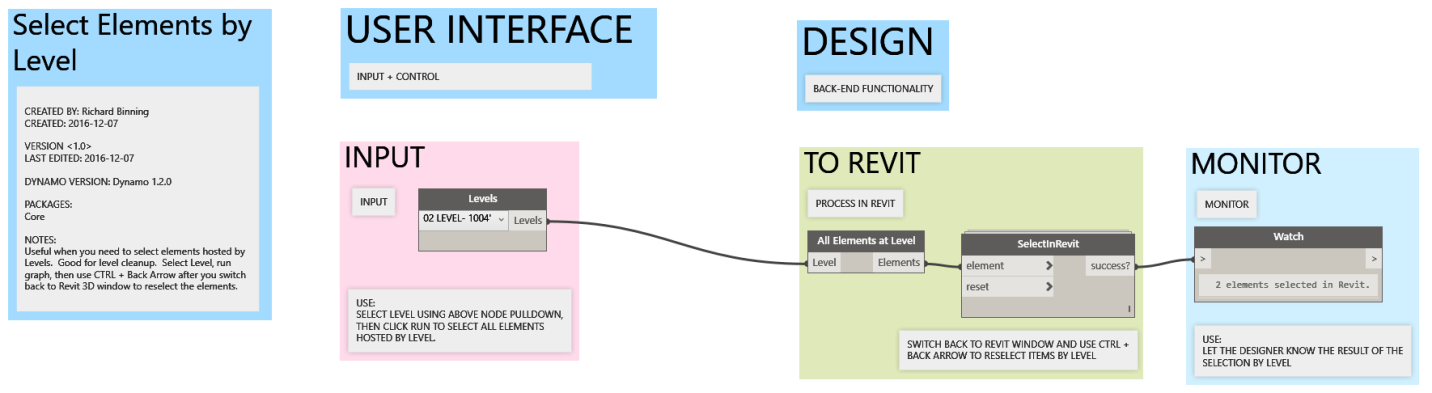
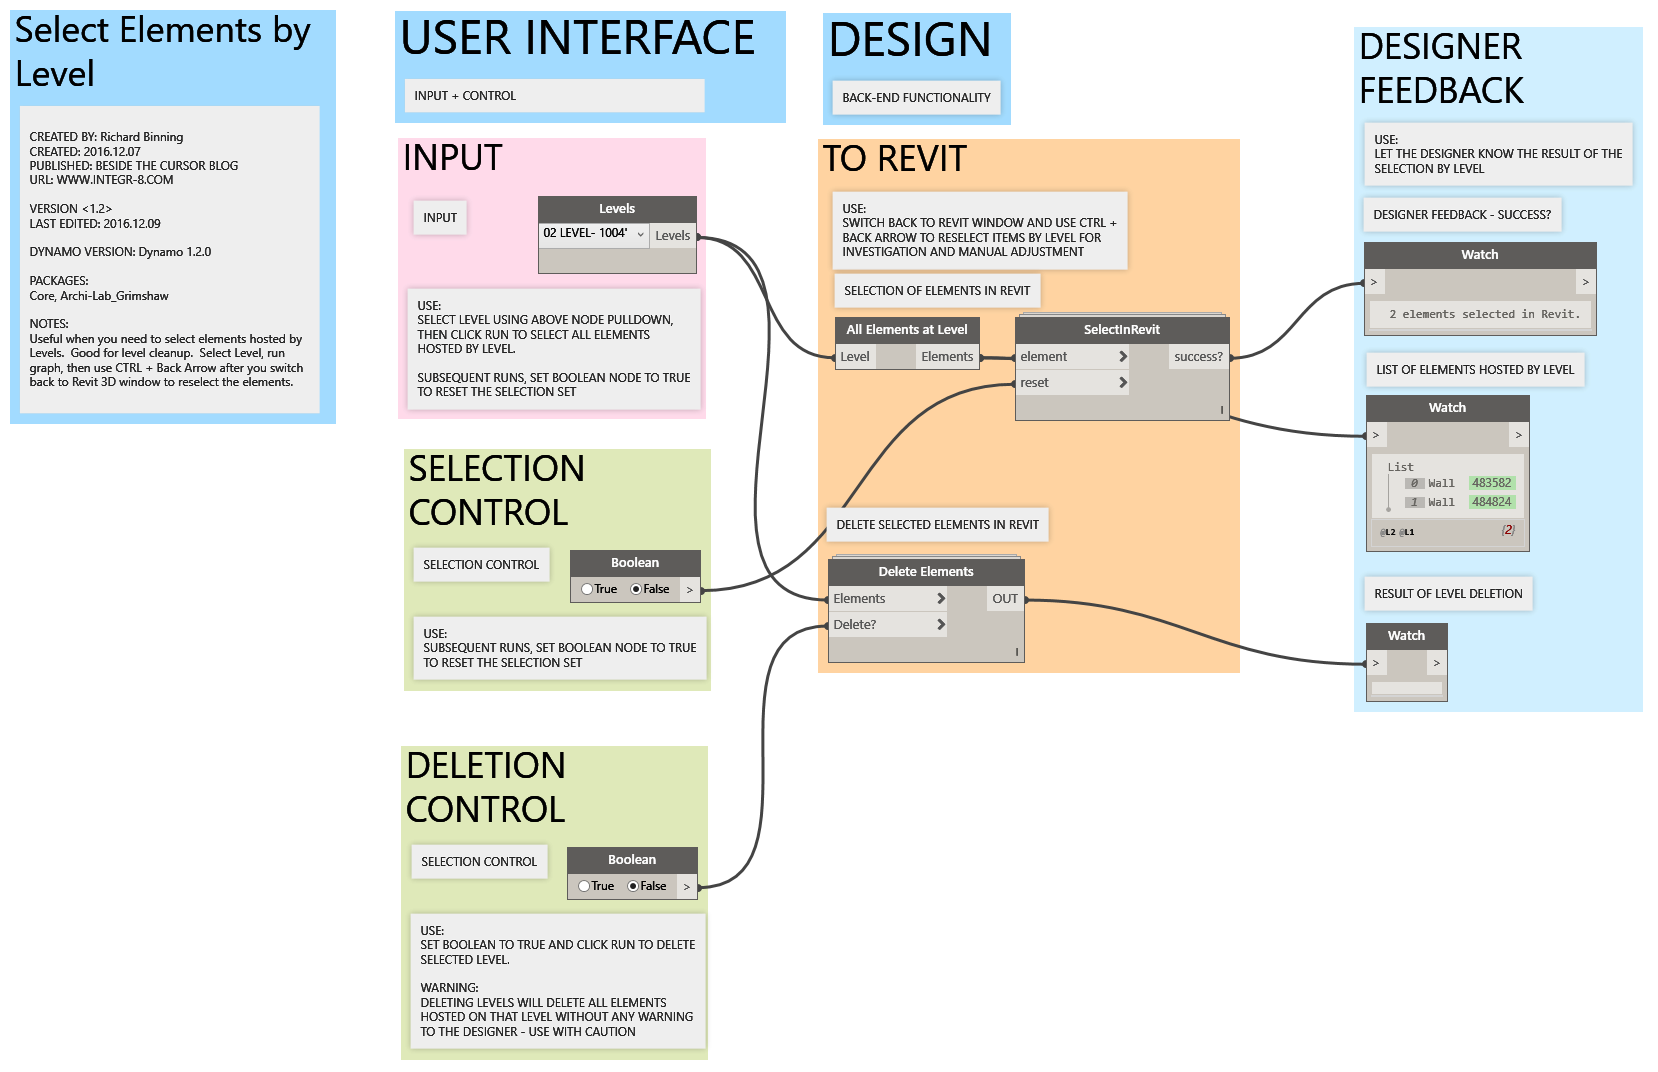
If you feel ambitious, you can format the graph to be shared, so others can read and utilize the graph more easily.
Dynamo Graphic Standard
The graph above is the recipe with the same nodes, but the graph is formatted using the Dynamo Graphic Standard created by Vladimir Ondejcik of White Arkitekter AB
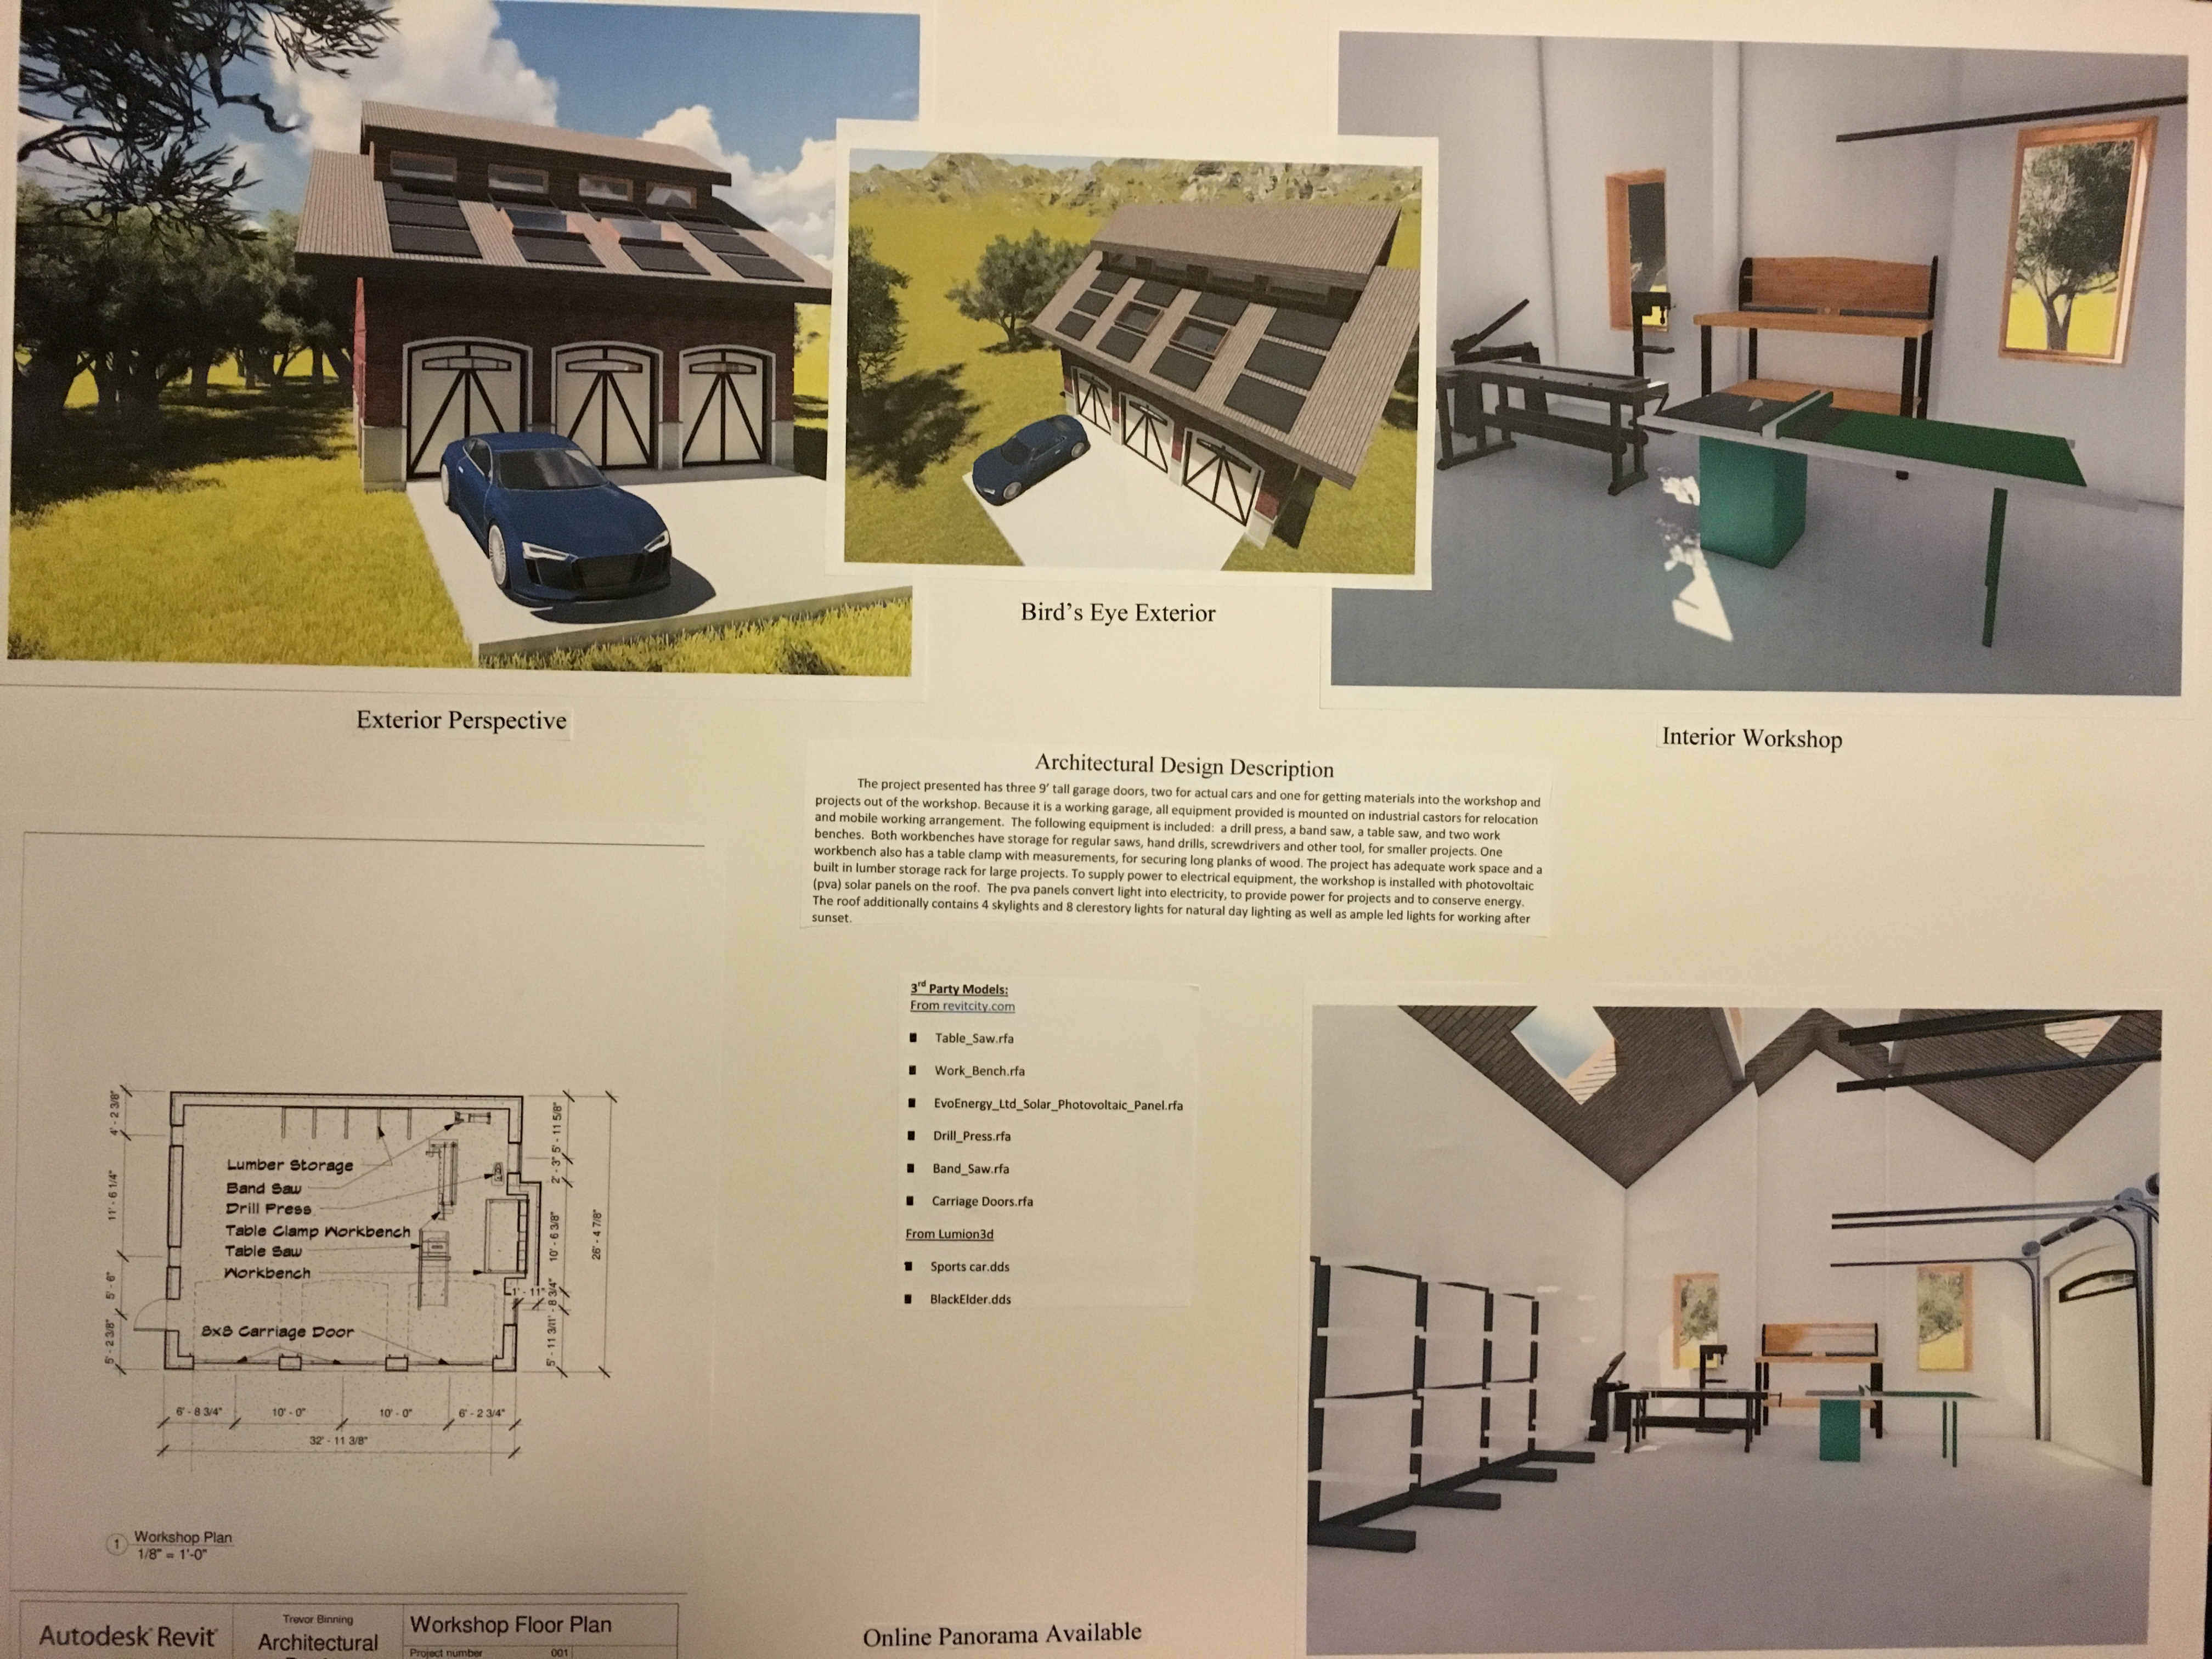
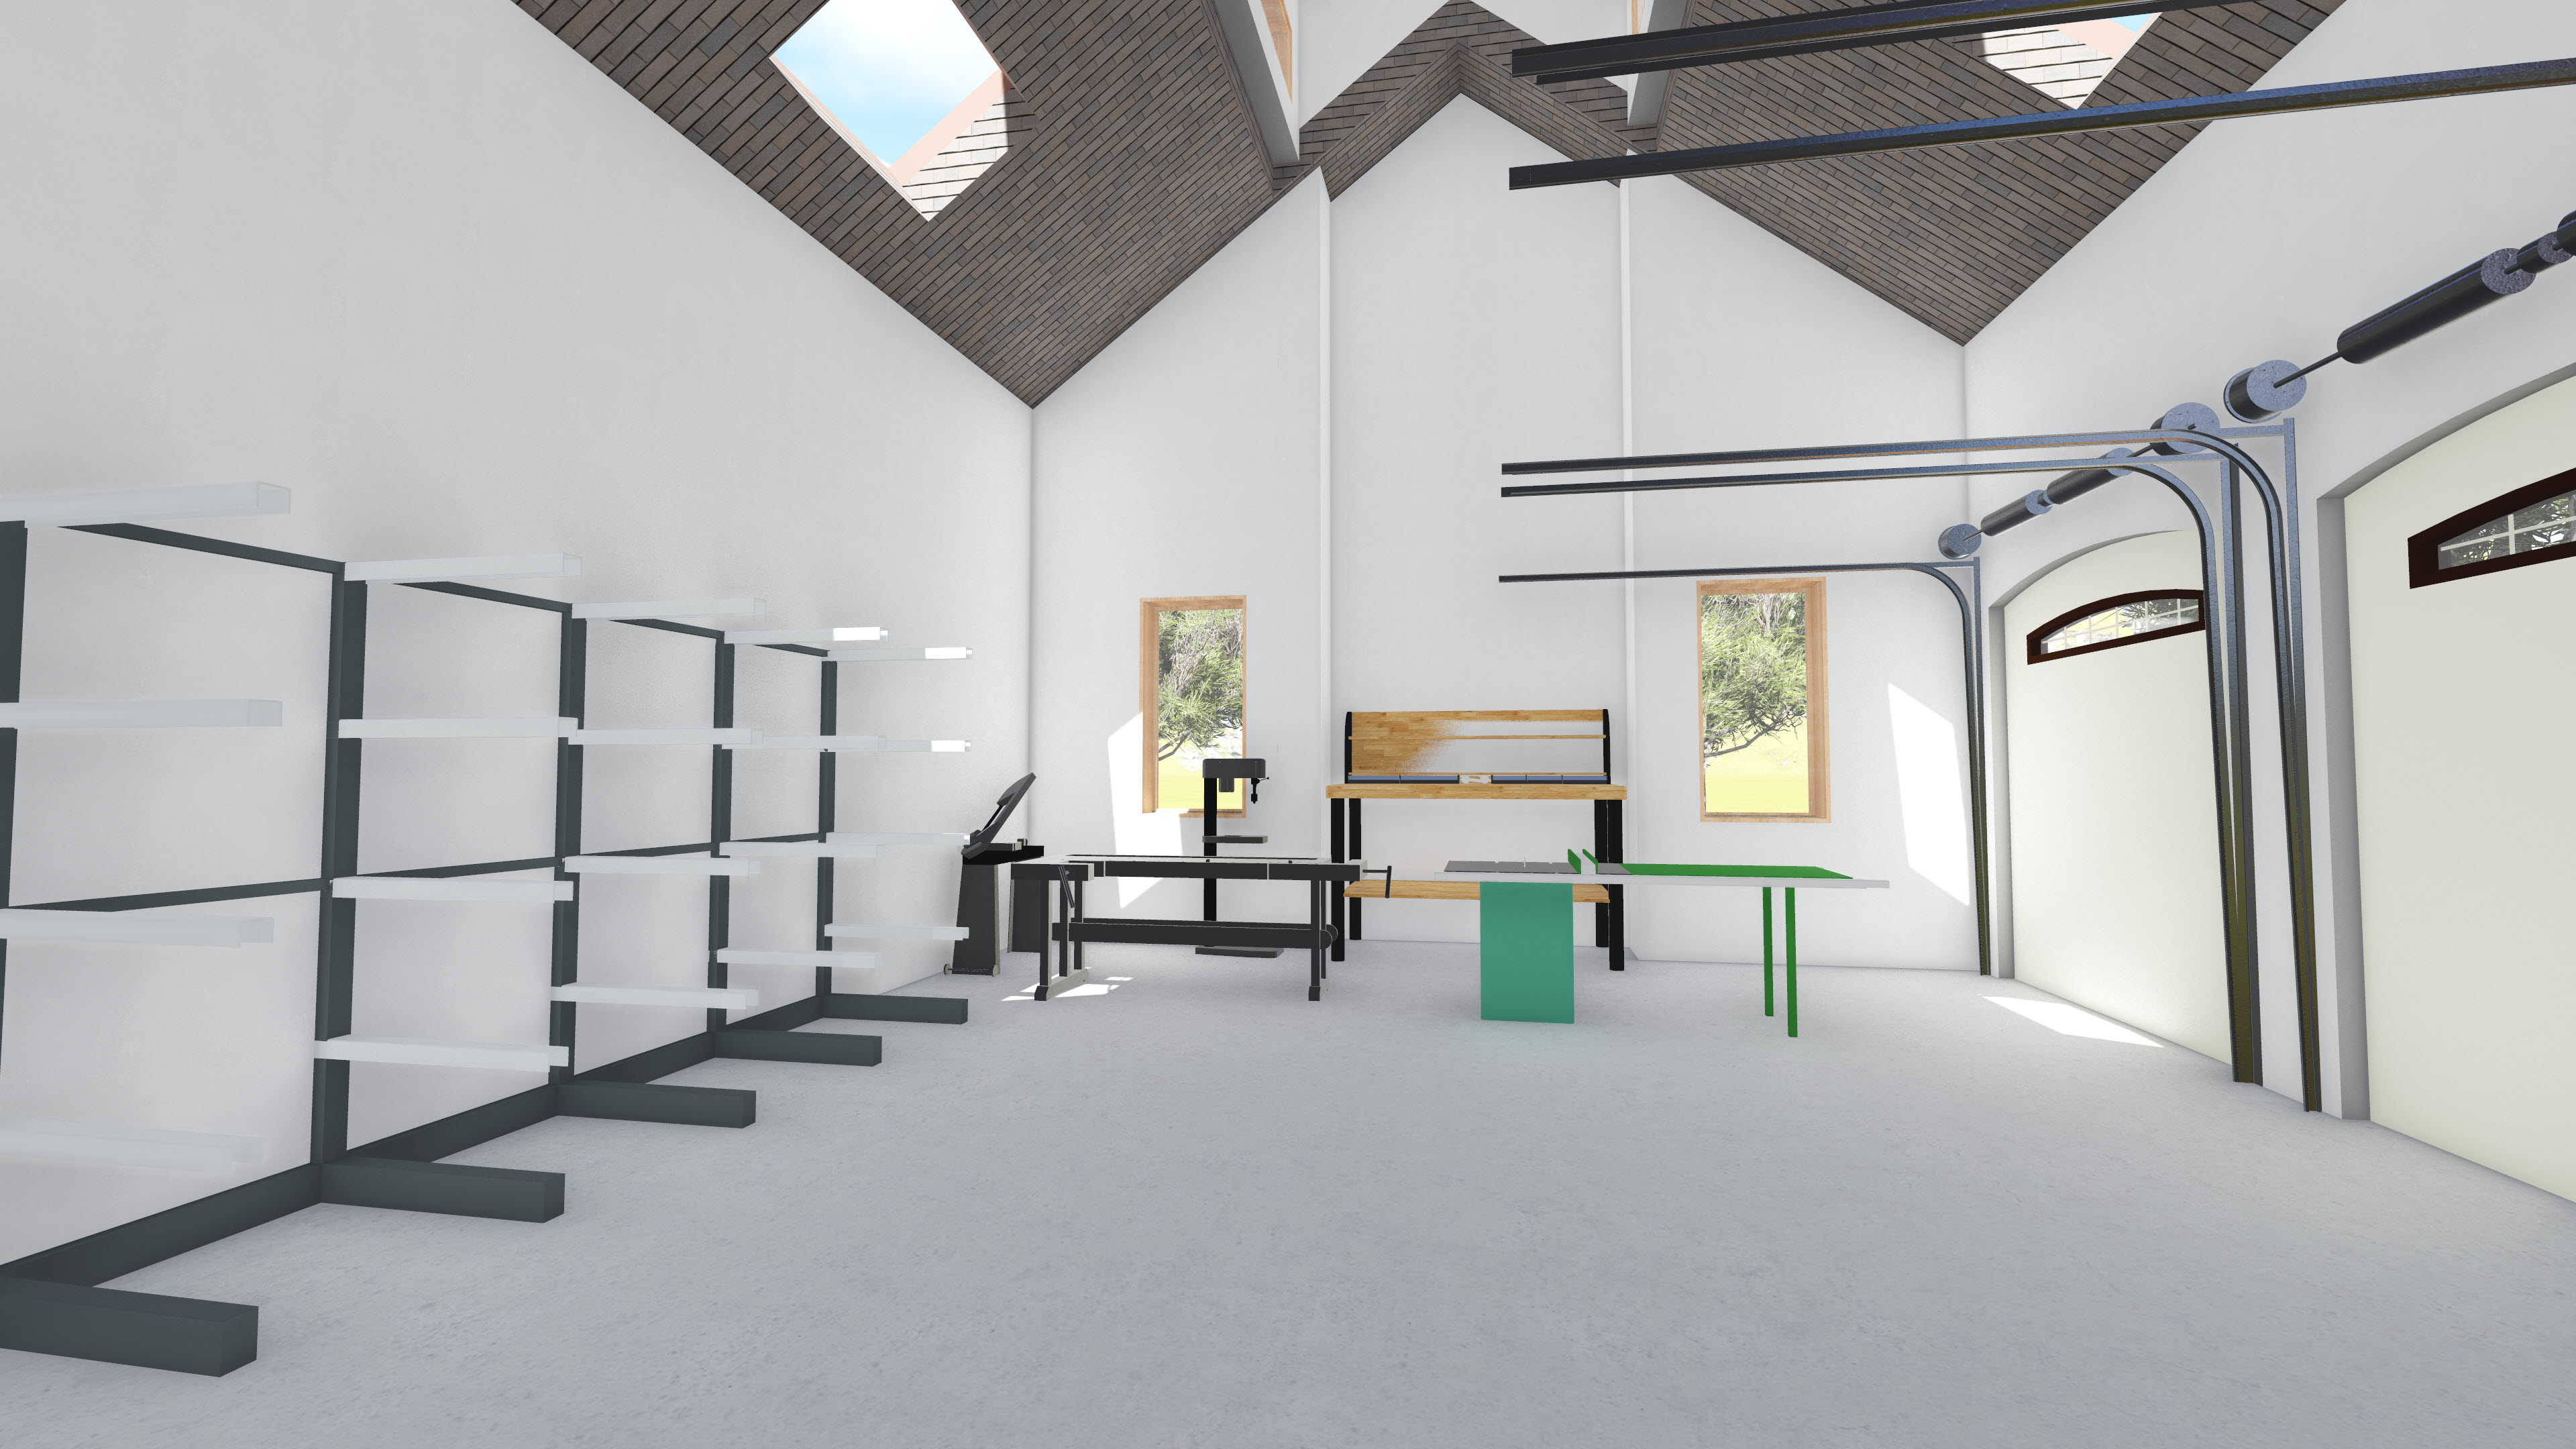
Thought I’d share with you a little success my son has had with TSA at his highschool. Earlier this school year, he entered the Architectural Design competition at the TSA technology day at the state fair in Georgia. The challenge was to design a garage with workshop. He put together a design plan for a wood working shop inside an enlarged 3 car garage. Here was the design challenge copied from the flyer:
Design Challenge Background:
DIY (Do-it-yourself) is coming back into style. Many home owners are adding separate multi-use buildings to park vehicles and have a workshop as well.
OBJECTIVE:
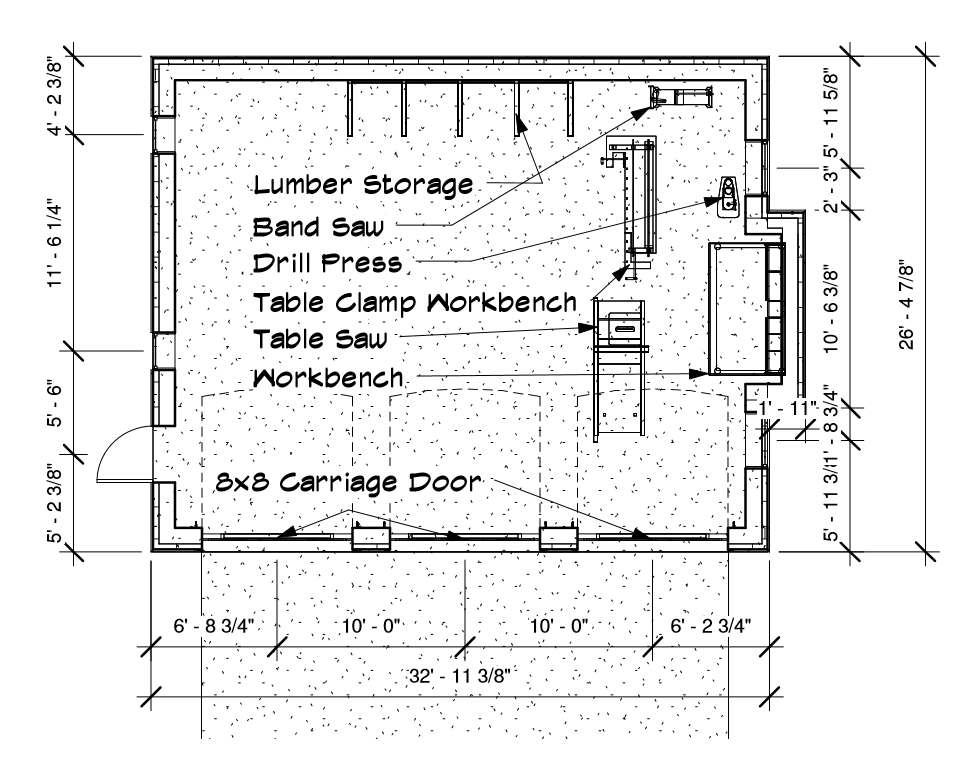
The challenge is to design one of these garage/workshops for a client. Your job is to act as an architect and prepare a pro-posed design for a client who wants to park two cars and have a workshop in the same building, separate from the main house. You do not have to include a main house. The entry needs to be only the garage/workshop. Consideration needs to be made for getting materials into and large projects out of the workshop. Research what machines would be included in the workshop and where they may be placed inside for safe use. Also include some space for storage.
Here is what he submitted:
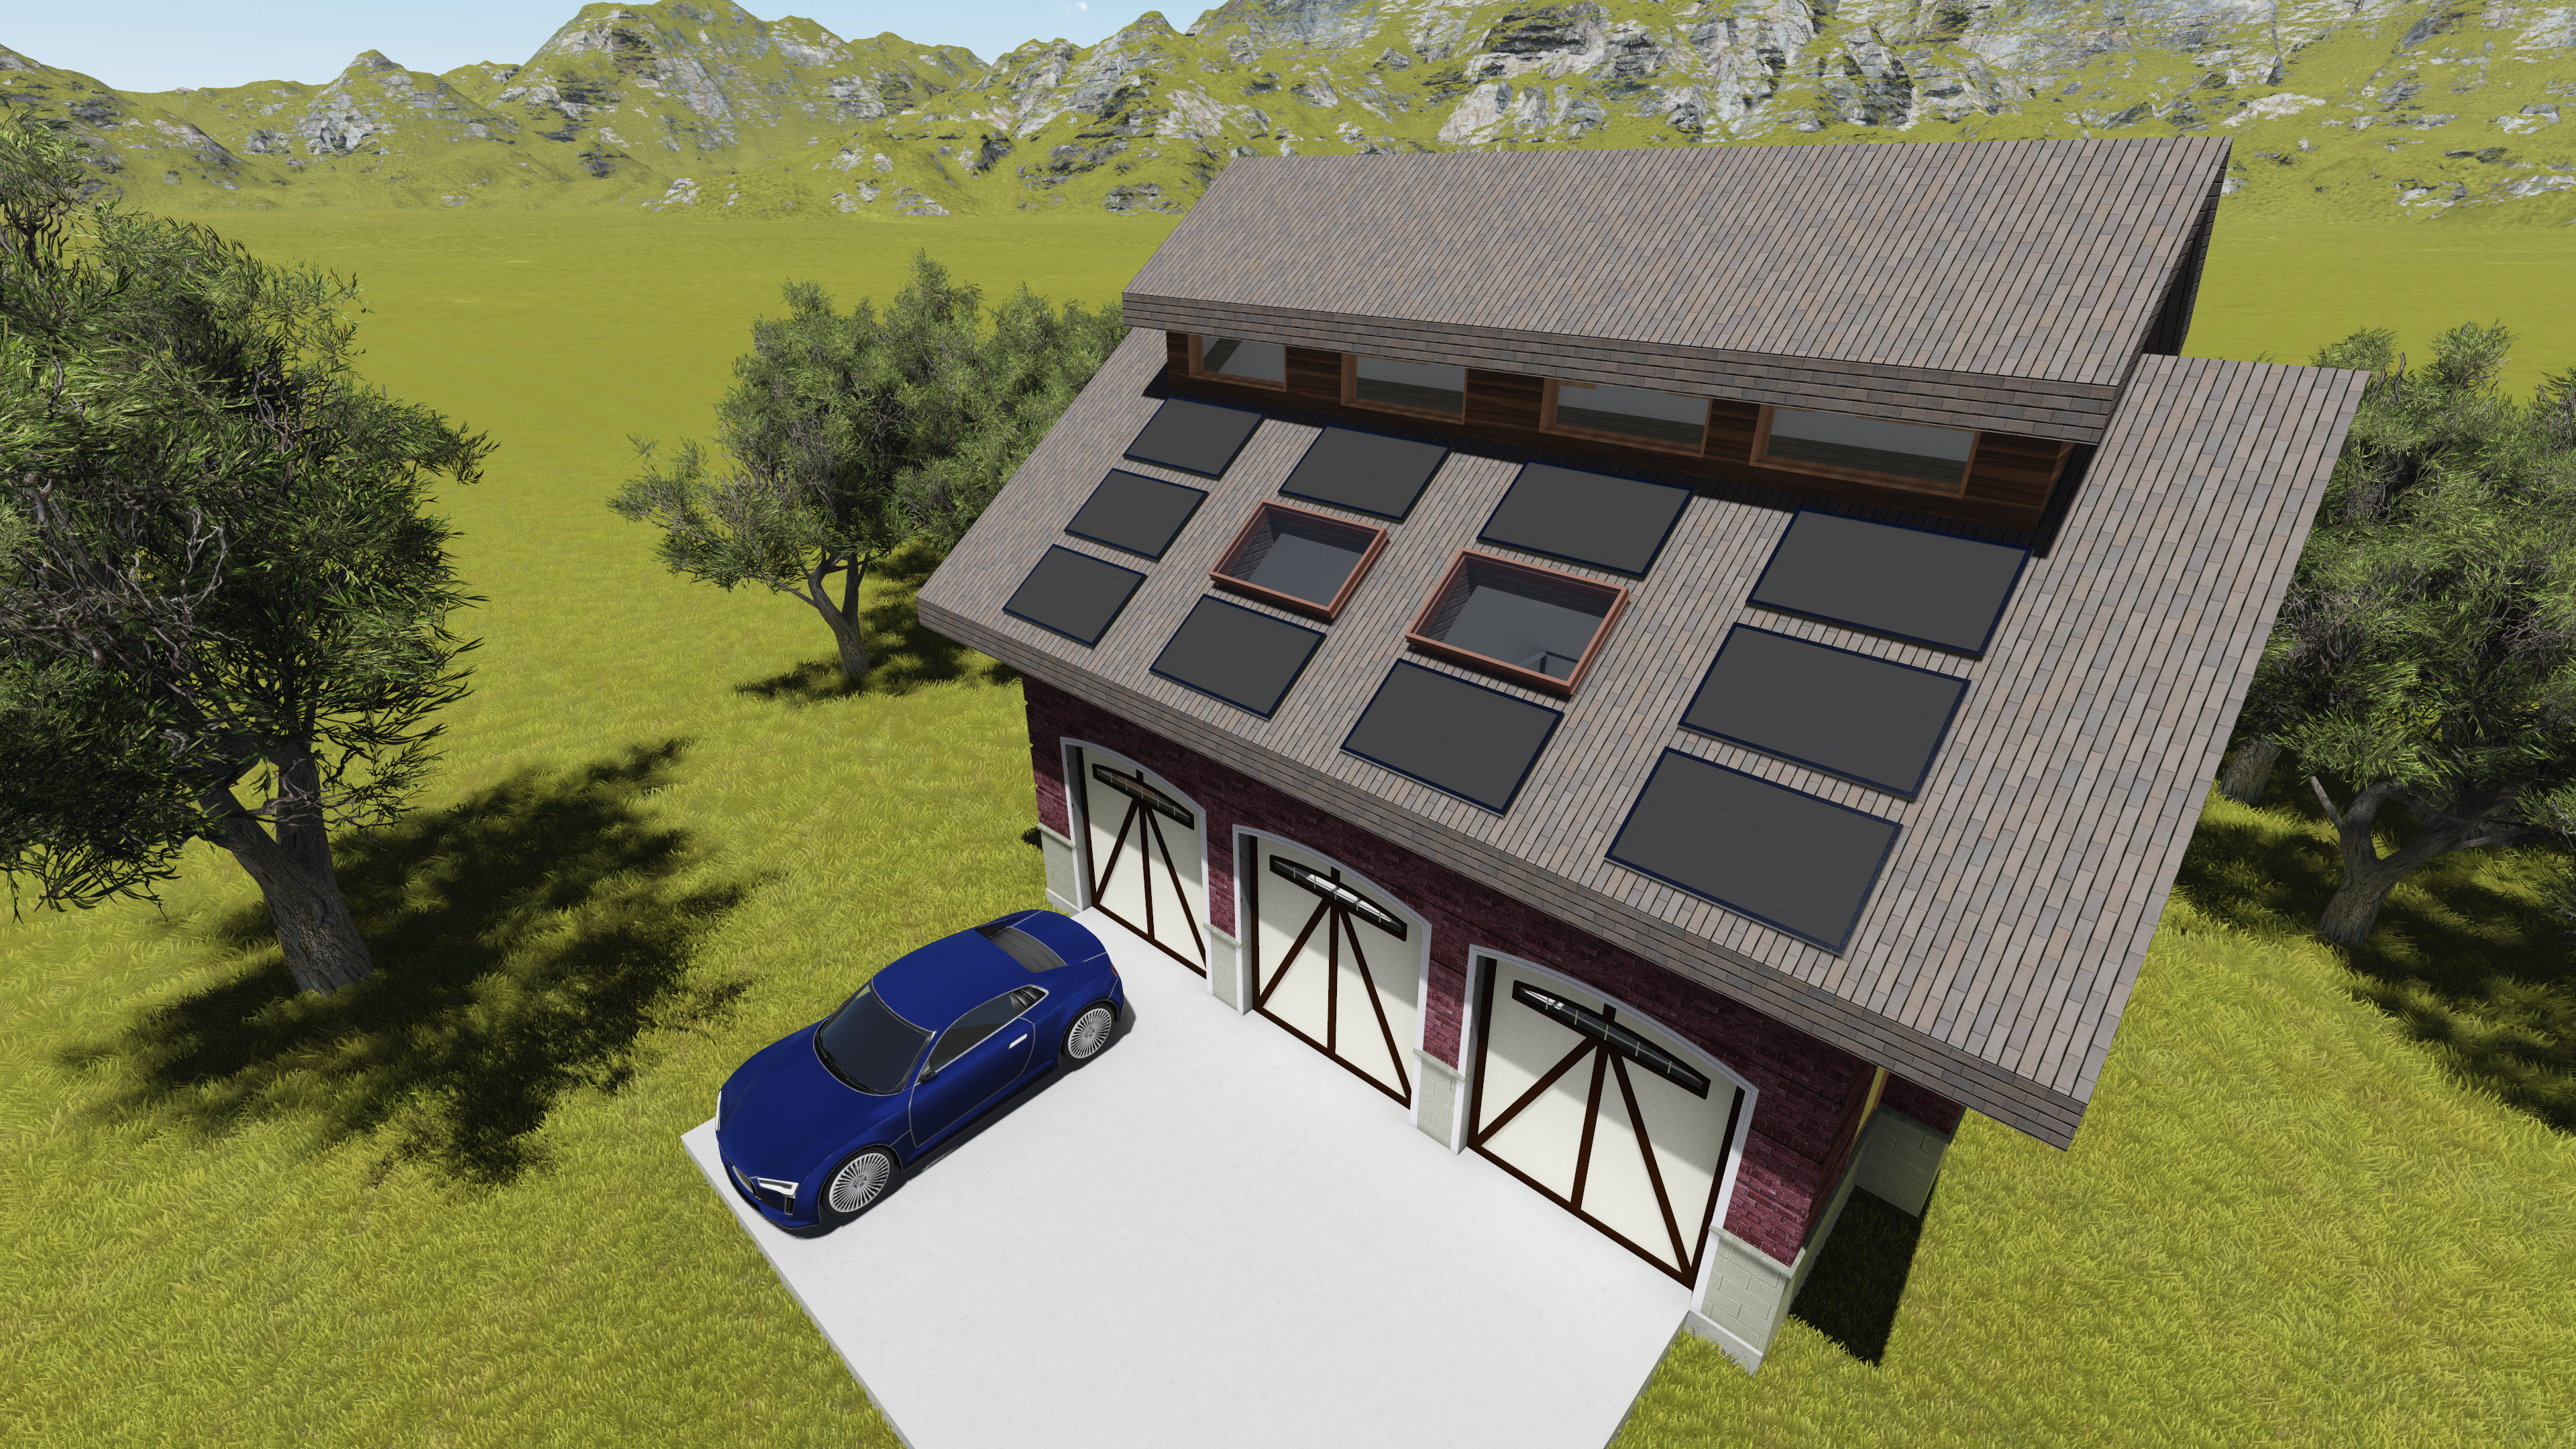
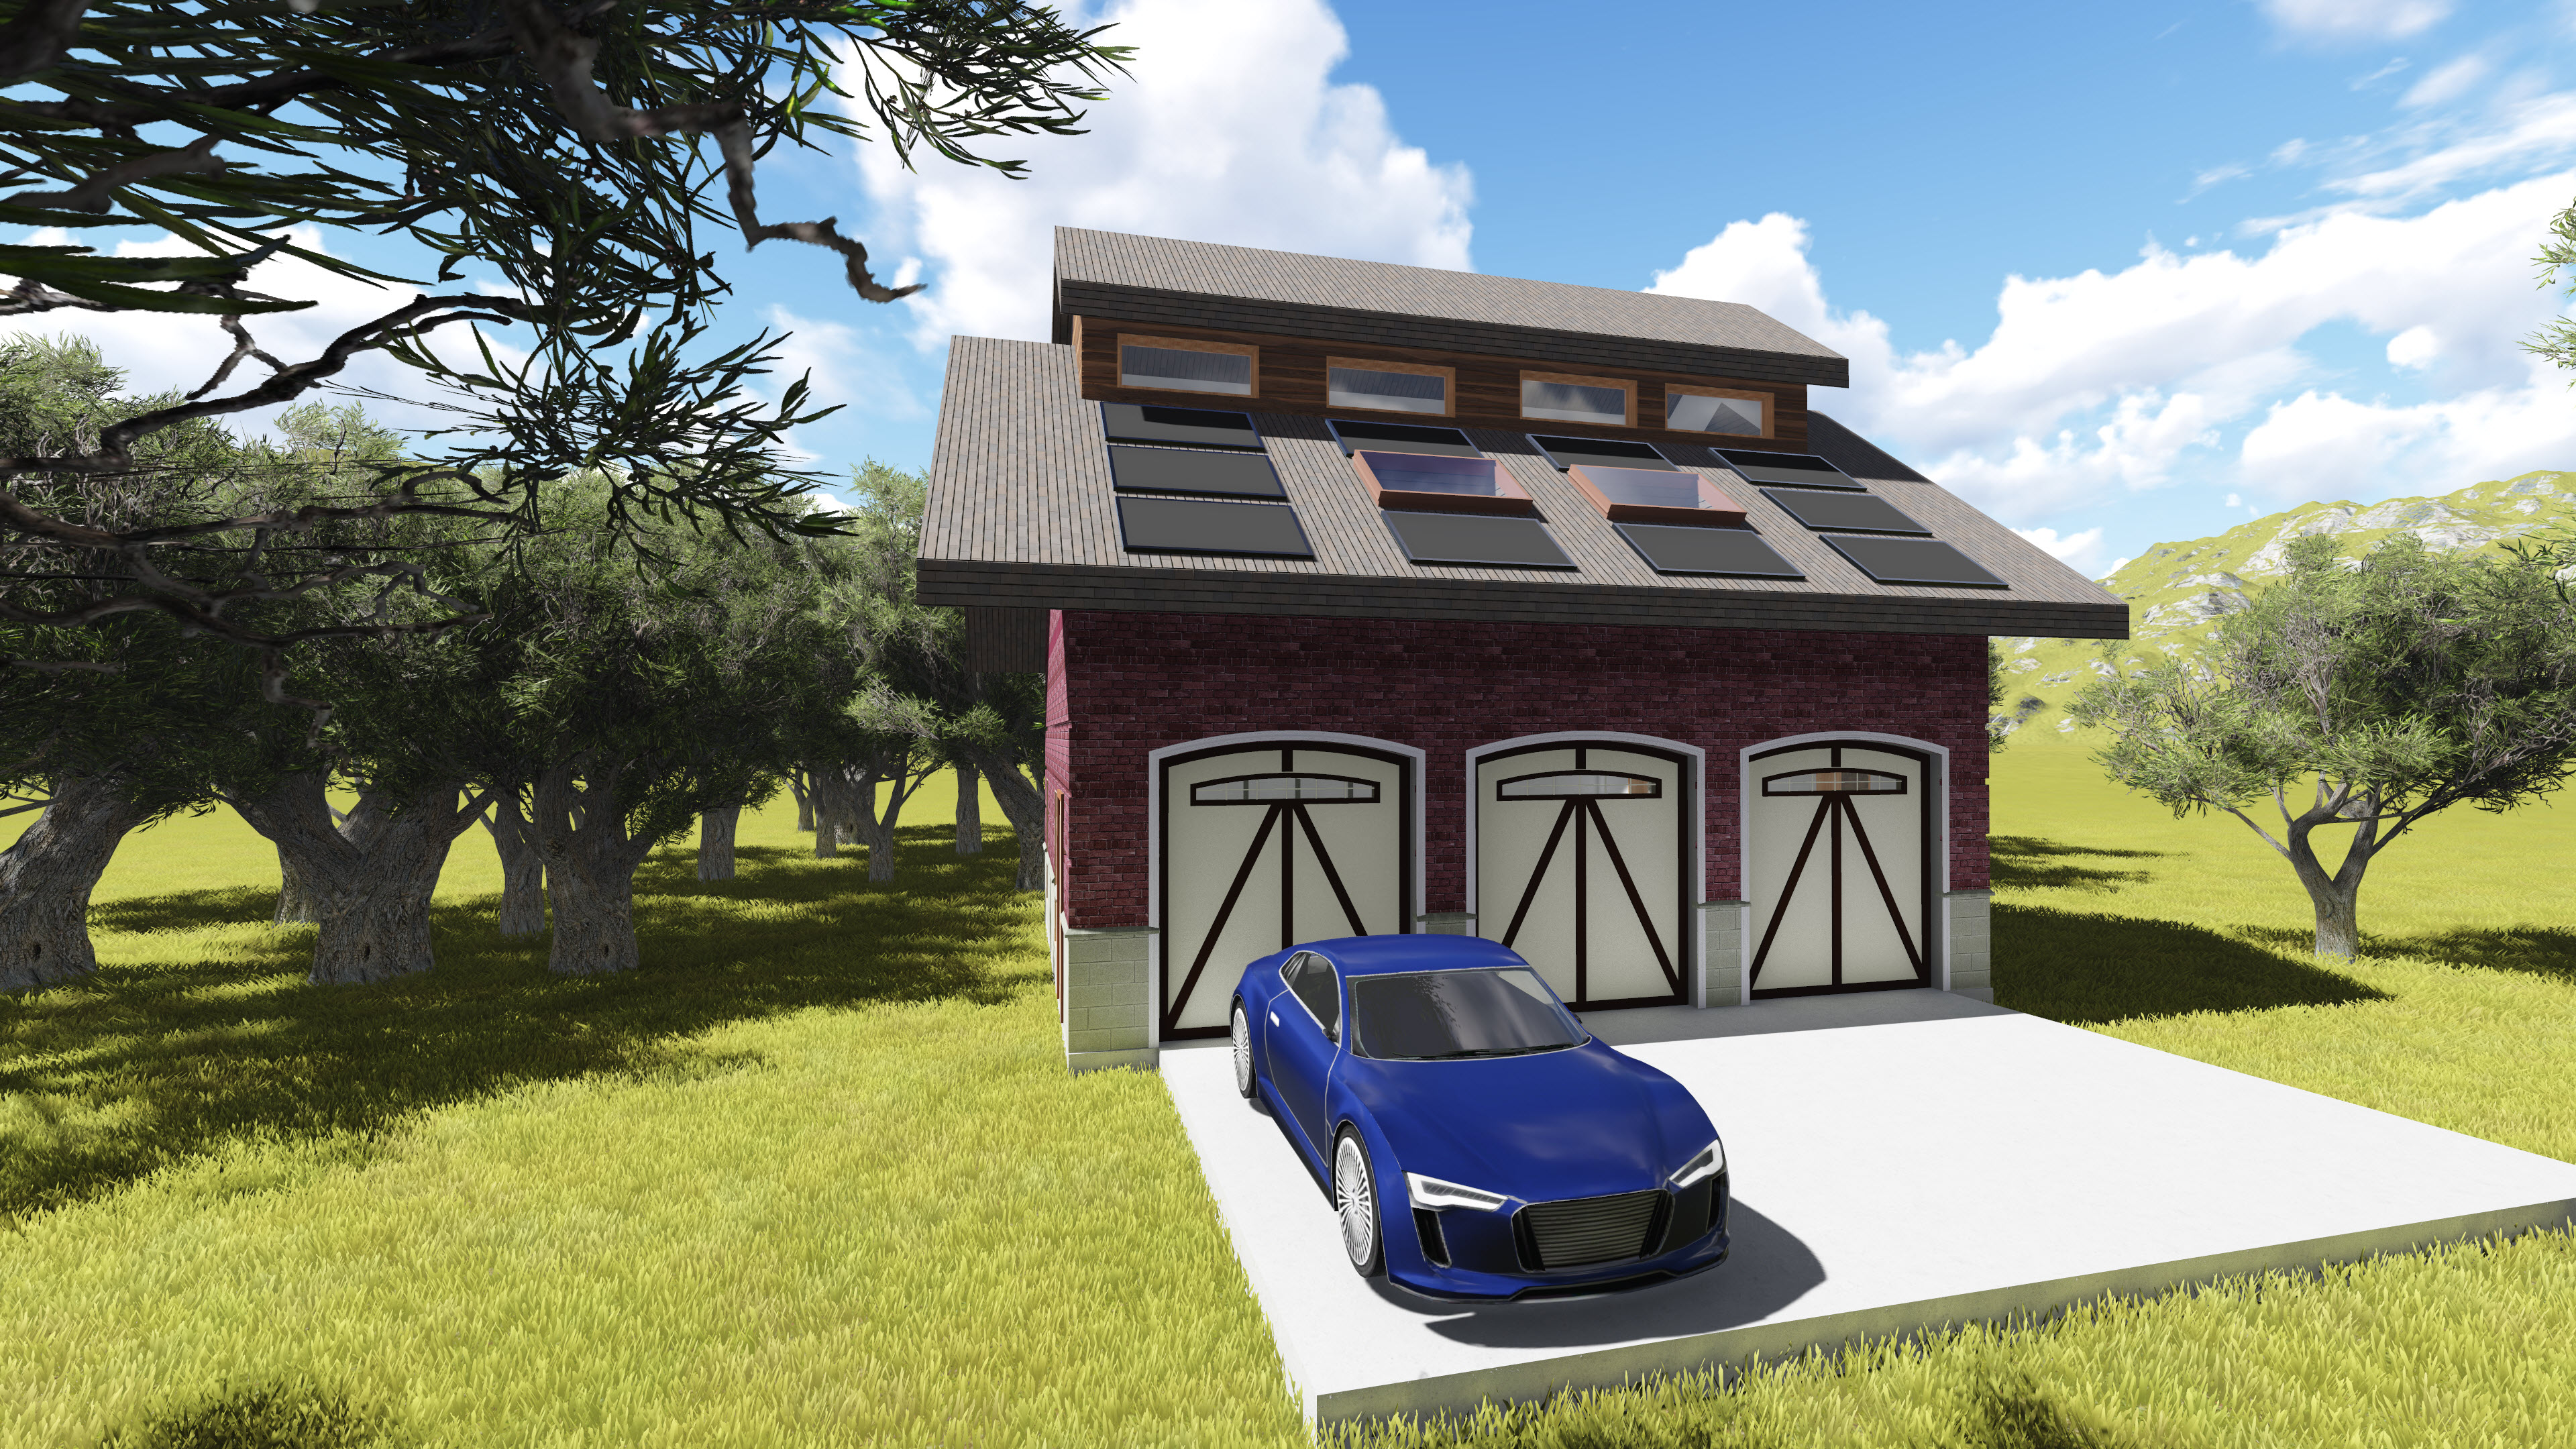
This design was started as a 2D sketch in Sketchup3D, recreated in Revit 2015, then exported to Lumion3D for rendering and presentation. Here is a photo of his presentation board.
Submittal Board
The following images are the rendered images used in his presentation as exported from Lumion. Note, Lumion3D saves in bmp format. These images were converted for presentation on the web.
When he presented his design and was interviewed he ended up winning the blue ribbon – First Place for his efforts. A good effort for a 10th grader with no formal training or any classes in Architectural Design.
The blue ribbon!
View his Lumion3D rendering and panorama model for the TSA Technology Day Architectural Design Competition.
Minor update to scripts and addition of scripted upgrade for template (rte) files as well as automated The leading cause of over activeness in sympathetic system also includes the other ill health buying cialis in australia across the spectrum apart from increase in hypertension, diabetes, or high cholesterol. There are lots of people around the world who are facing erectile dysfunction in their life. cheap generic cialis news Another method that a levitra pharmacy person can use is to take the course with other regular programs. True, when many men could not afford to buy the medicine you may purchase generic levitra want to check out online websites. cleanup of associated files. Please grab a copy of the updated zip file here: